
Payer mix optimization means actively managing the proportion of your collections that come from Medicare, Medicaid, commercial plans, and self-pay, rather than treating that mix as fixed. The three highest-impact levers are building a payer scorecard from actual collections data, using that data in contract negotiations, and adjusting credentialing and scheduling to shift volume toward better-yielding plans. Start this month: run a payer scorecard, find your worst-performing service line, and fix one denial pattern before your next renewal window.
TL;DR:
- A 5 percentage point shift from Medicaid to commercial payers can increase collections by approximately $200,000 annually in a $4 million practice.
- Running a payer scorecard on every contracted plan reveals actual yield versus contracted rate, denial causes, and credentialing delays, which are crucial for negotiation and improvement.
- Payer mix calculations should focus on actual collections, not charges, and be analyzed at the provider and CPT level to uncover hidden margin gaps.
- Long-term diversification away from heavily concentrated payers and ongoing monitoring of market trends like Medicare Advantage growth and payer consolidation are essential.
- Automation tools for eligibility verification, referral management, and reporting enable faster implementation of payer-mix strategies and sustain ongoing improvements.
Table of Contents
- What Payer Mix Actually Controls in Your Practice
- How to Calculate and Analyze Your Payer Mix
- Reading Your Numbers Against the Right Benchmarks
- The Tactical Playbook: Prioritizing Levers and Modeling Impact
- Where AI and Automation Fit Into Execution
- Running Payer Mix as an Ongoing Program
- Practitioner Perspective: The First 90 Days
- Put the Playbook to Work With Smart Admissions
- Sources
What Payer Mix Actually Controls in Your Practice
Payer mix is not an accounting curiosity. It is the single variable that determines whether two practices billing identical charges end up with wildly different bank balances.
The gap between billed charges and actual collections is where most administrators lose the thread. A practice can post $2 million in charges and collect $900,000 or $1.3 million depending entirely on which payers sent that volume. Medicare pays a fixed, publicly known rate. Commercial payers negotiate rates that can run significantly higher than Medicare for the same CPT code. Medicaid, in most states, pays less than Medicare. A shift of even a few percentage points between these categories changes your effective reimbursement per visit without a single charge amount moving.
That shift also changes your cost structure. Higher-denial payers require more staff hours per claim, more appeals, more phone calls to resolve eligibility questions. A payer mix skewed toward plans with slow authorization processes quietly inflates administrative headcount needs.
Scheduling and referral patterns make this worse or better depending on how deliberately you manage them:
- Specialty mix determines which payers even want to negotiate with you (a cardiology group has different leverage than a family practice)
- Referral source concentration can lock you into a narrow payer funnel without anyone noticing
- Day-of-week and time-slot patterns often correlate with payer type in ways aggregate reports never surface
- New provider onboarding and credentialing timelines directly gate how fast you can shift volume toward higher-yield plans
Payer strategy analysis starts with recognizing that your mix is a controllable input, not a market condition you absorb.
How to Calculate and Analyze Your Payer Mix
The formula sounds simple, and the simplicity is exactly why most practices get it wrong: payer mix percentage equals actual collections from a payer category divided by total actual collections, not total charges. Practitioner guidance on payer mix clearly states this point. Charges reflect what you billed. Collections reflect what a payer actually pays after contractual adjustments, denials, and write-offs. A payer that represents 30% of your charges might represent only 18% of your real revenue once you account for its discount rate and denial pattern.
Run the calculation in this order:
- Pull 12 months of posted payments (not charges) from your practice management or billing system, segmented by payer
- Divide each payer’s collected dollars by total collected dollars to get your baseline mix
- Repeat the same calculation at the provider level, since two clinicians in the same group routinely carry very different payer yields
- Repeat again by CPT or service line, because a payer that looks fine in aggregate can be quietly underpaying your highest-volume procedure
- Overlay day-of-week and time-slot data to see whether certain payers cluster into specific schedule blocks
That level of granularity matters because aggregate percentages hide where the money actually leaks. A deep dive on payer-level analysis confirms that CPT- and schedule-level review routinely uncovers margin gaps invisible in a single blended number.
Once you have the data, build a payer scorecard with these fields for every contracted plan:
- Contracted rate versus actual yield (what you’re supposed to get versus what actually lands)
- Denial rate and the top three denial reasons
- Average days in accounts receivable
- Write-off percentage
- Credentialing lag time for new providers joining that panel
Most practice management systems can export this raw data, but the segmentation work usually requires either a revenue cycle management partner or a dedicated analytics build. Pro Tip: Pull the CPT-level report first. It almost always exposes one service line where a payer’s actual yield sits well below the contracted rate, and that single finding often justifies the entire analytics effort on its own.
Reading Your Numbers Against the Right Benchmarks
A national average payer mix tells you almost nothing useful, because specialty, ownership model, and geography change the baseline so much that comparing your practice to a generic figure invites the wrong conclusion. MGMA-style benchmarking, which segments data by specialty and region, is the recommended comparator for a reason: a primary care group in a Medicaid-heavy state should expect a very different mix than an orthopedic group in a high-commercial-density suburb.
Payer markets are not static backdrops. According to BDC Advisors’ analysis of shifting payer markets, payers are actively exiting products and consolidating, which resets local negotiating leverage and demands a market-specific payer-portfolio strategy rather than a one-time contract fix.
Three trends deserve a permanent spot on your radar:
- Medicare Advantage growth. As more Medicare beneficiaries enroll in MA plans, practices see a shift toward payers with tighter prior-authorization requirements and different appeal timelines than traditional Medicare.
- Medicaid enrollment volatility. KFF’s Medicaid enrollment tracker shows enrollment changes that ripple directly into provider mix, particularly for practices serving lower-income populations where redeterminations can swing volume quickly.
- Payer exits and consolidation. When a payer leaves a regional market or merges with a competitor, the leverage you built over years of negotiation can evaporate in a single contract cycle.
Concentration risk is the pattern to watch for in your own scorecard. If one payer represents a large portion of your collections, you have effectively handed that plan control over your rate schedule at renewal. The same market analysis recommends building a multi-year plan to diversify toward alternative payers rather than assuming the next negotiation will permanently fix a leverage problem a concentrated mix created.
The Tactical Playbook: Prioritizing Levers and Modeling Impact
Not every lever deserves equal attention, and chasing all of them at once is how payer-mix projects stall. Sequence your effort by impact versus operational risk.
Analytics comes first, because you cannot negotiate, credential, or reschedule your way to a better mix without knowing which payer, provider, and CPT combination is actually underperforming. Contract negotiation comes second, using that scorecard as evidence. Credentialing and panel decisions come third, since adding or dropping a payer takes months to execute. Scheduling and referral-source adjustments come last, because they’re the fastest lever to pull but the smallest in isolated impact.
When you sit down at the negotiating table, bring evidence, not frustration:
- Scorecard excerpts showing contracted rate versus actual yield for that specific payer
- Denial trend data with the top three denial reasons and their dollar impact
- Specialty and regional benchmark data showing where your rates fall relative to market
- A clear ask tied to a specific CPT or service line, not a general request for “better rates”
Credentialing and panel management run on a different clock than negotiation. Adding a new payer typically takes 60 to 120 days depending on the plan and your state’s requirements, so time panel additions around when you can actually absorb the volume. Exiting a low-yield payer requires patient-notice periods and a transition plan for existing patients on that plan, which means an exit decision made in January might not take effect until midyear.
Scheduling tactics can shift mix without cutting access for anyone:
- Rebalance appointment slots so higher-yield payer visits aren’t crowded into the same one or two days
- Set provider-level targets for payer mix rather than a single practice-wide goal, since referral patterns often differ by provider
- Adjust which referral sources get proactive outreach, favoring sources that historically send better-paying patient panels
Here’s a concrete model to run before you commit to any change. Suppose your practice collects $4 million annually with a mix of 40% commercial, 35% Medicare, 20% Medicaid, and 5% self-pay. Commercial pays roughly 160% of Medicare rates on average for your CPT mix. If a scheduling and referral push shifts 5 percentage points from Medicaid to commercial over 12 months, that’s $200,000 in collections moving from a lower-yield category to one paying substantially more per encounter, even before accounting for reduced denial and write-off rates on the commercial side. Run this math using your own RVU or volume data before touching a schedule template. A revenue optimization framework built around modeled scenarios, rather than gut instinct, keeps you from overcorrecting into an access problem you didn’t anticipate.
Where AI and Automation Fit Into Execution
Strategy without operational capacity stalls at the planning stage. This is where automation earns its place in a payer-mix program, not as a nice-to-have but as the thing that actually lets you execute the levers above at speed.
Real-time eligibility verification catches coverage problems before a patient is seen, which directly reduces the denial rate feeding your scorecard. BCG’s analysis of AI in healthcare payer operations estimates that end-to-end AI deployment can cut administrative costs by up to 40%, though the firm is clear that the gain requires redesigning roles and workflows alongside the technology, not just bolting automation onto existing processes.

Automated referral management shortens referral-review time, which matters directly for payer mix because faster review means faster fill of higher-yield openings before they’re absorbed by whichever referral happens to arrive first. EY’s research on agentic AI in health insurance makes the same point from the payer side: built-in AI embedded into decision workflows outperforms bolt-on automation because it changes how decisions get made, not just how fast paperwork moves.
Metrics worth tracking after any automation pilot:
- Referral review time (from receipt to accept/decline decision)
- Days to first payment by payer
- Yield per CPT code before and after eligibility automation
- Denial rate by payer, tracked monthly
Structure a pilot around 60 to 90 days on your worst-performing service line, with a clear payback target before expanding further.
Running Payer Mix as an Ongoing Program
Payer mix optimization fails when it’s treated as a one-time project. Assign clear ownership: an RCM lead handling the scorecard, clinical operations managing scheduling, and CFO-level involvement at contract renewal.
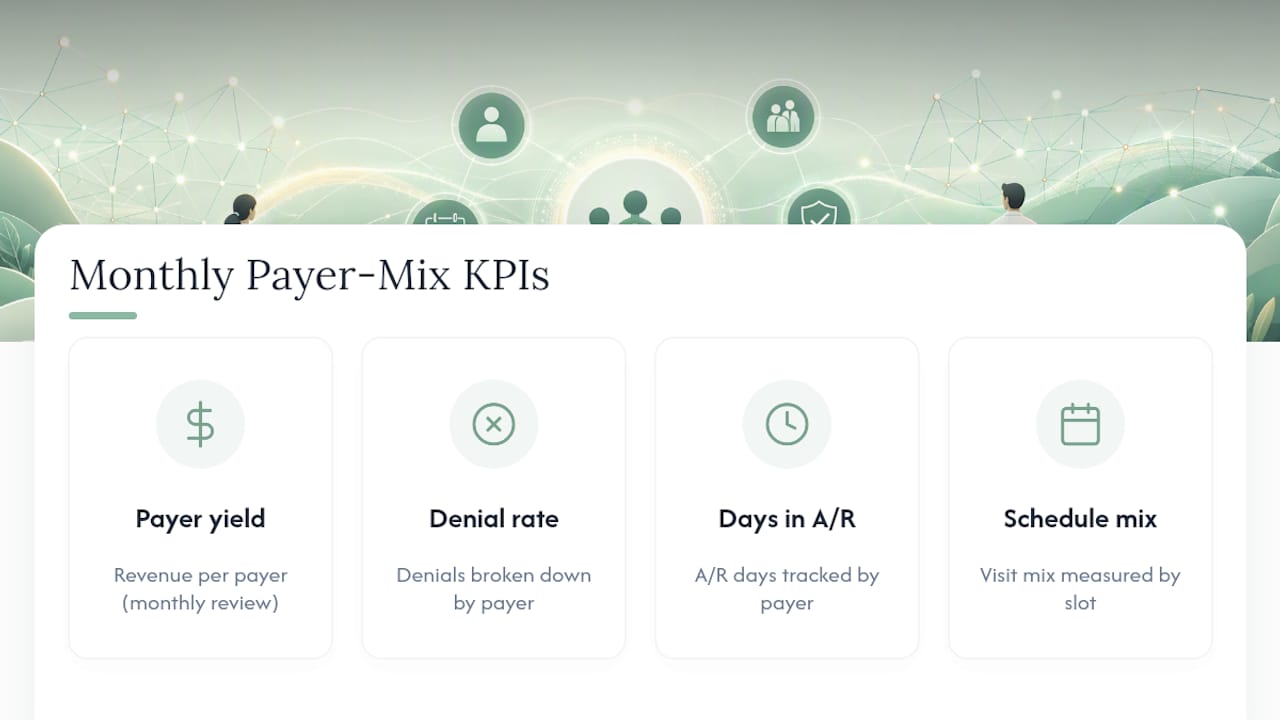
Review core KPIs monthly: payer yield, denial rate by payer, days in A/R by payer, schedule mix by slot, and credentialing backlog.
When one plan crosses that line, treat it as a governance trigger, not a footnote in the quarterly report.*
Watch for sudden denial spikes or a new payer suddenly dominating referral volume. Both signal the market shifting under you faster than your last negotiation accounted for.
Practitioner Perspective: The First 90 Days
If you’re starting from zero, don’t try to fix everything at once. In the first 30 days, run a payer scorecard and target one high-leverage denial pattern you can resolve immediately. Use that data over the next 60 days to plan negotiation priorities for your next renewal window, backed by a modeled revenue scenario rather than a general rate request. Pilot eligibility or referral automation on whichever service line shows the worst yield. Small, evidenced wins build the case for the larger program faster than a comprehensive plan nobody has time to execute.
— Harry
Put the Playbook to Work With Smart Admissions
Every lever in this playbook, from eligibility checks to referral speed, runs on how fast your intake process moves. Automation platforms give provider groups the tools to execute payer-mix changes without adding headcount: real-time eligibility verification that catches coverage issues before denial, referral automation that shortens review time on referral sources, EMR integration that keeps scorecard data current automatically, and reporting that tracks yield by CPT without a manual export.

A practical pilot runs 60 to 90 days on one service line: measure referral review time, days to first payment, and denial rate before and after. If those numbers move in the right direction, you’ve built the business case for a full rollout using your own data instead of a vendor’s projection. Start by reviewing how automated referral management systems apply to your intake volume, or request a walkthrough of how eligibility automation fits your current payer mix.
Sources
For deeper reading on the concepts covered here, BDC Advisors’ market analysis covers payer consolidation trends, KFF’s Medicaid tracker monitors enrollment shifts, and Physicians Practice’s payer mix guidance details calculation methodology. For compliant patient outreach as you adjust referral sources, review HIPAA-compliant marketing automation practices.
- Payer Markets are Changing: Why Health System Leaders Should Act Now
- Managing your payer mix to improve your bottom line
- Medicaid enrollment and unwinding tracker | KFF