
TL;DR:
- Referral quality assesses how well incoming patient referrals match a facility’s clinical criteria and operational capacity. Using specific KPIs and qualitative feedback helps healthcare teams identify high-value referral sources and improve admission outcomes. Regular evaluation and relationship management ensure a consistent, data-driven approach to optimizing referral performance.
Referral quality is defined as the degree to which an incoming patient referral meets your facility’s clinical criteria, insurance requirements, and operational capacity before admission. Knowing how to evaluate referral quality separates facilities that fill beds efficiently from those that waste intake resources on referrals that never convert. A referral that looks promising on paper but misses your ideal patient profile costs your team time, delays bed turnover, and reduces revenue. The good news is that a structured assessment framework, built on clear metrics and qualitative checks, gives your admissions team a repeatable way to score every referral before committing resources.

How to evaluate referral quality with the right KPIs
The most common mistake in referral quality assessment is measuring volume instead of value. A referral source that sends 40 patients per month but converts only 20% of them is less valuable than one that sends 15 patients and converts 60%. Your team needs metrics that reflect downstream outcomes, not just top-of-funnel activity.
The core KPIs for measuring referral success are:
- Referral conversion rate. This is the percentage of referred patients who complete admission. Sources with conversion rates below 35% typically lack a clear understanding of your ideal patient profile or clinical requirements. That threshold is your minimum acceptable benchmark.
- Pipeline coverage ratio. A healthy referral pipeline maintains a 2.5X to 3X coverage ratio, meaning you have 2.5 to 3 times more qualified referrals in review than available beds. Ratios below 2X signal insufficient lead flow to meet intake targets.
- Retention and lifetime value. Referred patients show significantly higher retention rates and spend over time compared to non-referred admissions. This matters because acquiring a new patient costs 5 to 25 times more than retaining an existing one.
- Average revenue per patient (ARPU). Weighting your scoring toward retention and ARPU rather than click-level signals gives you a true picture of long-term referral value.
Tracking referral conversion rates alongside pipeline coverage gives your team two complementary lenses. One tells you how well referrals convert today; the other tells you whether your pipeline is healthy enough to sustain future admissions targets.
Pro Tip: Set a monthly review cadence for each KPI. If a referral source’s conversion rate drops below 35% for two consecutive months, flag it for a qualitative review before cutting it from your pipeline.
Why qualitative data is just as critical as the numbers
Quantitative metrics tell you what is happening. Qualitative data tells you why. Combining both is not optional. Organizations that integrate quantitative and qualitative frameworks are 2.3 times more likely to optimize their referral programs successfully. That finding from Bain & Company research means facilities relying on numbers alone are working at a structural disadvantage.
Qualitative methods that improve your ability to assess referral effectiveness include:
- Referrer surveys. Ask referring physicians and case managers whether they understand your admission criteria. Misalignment at this level explains most low-conversion referrals.
- Patient interviews at intake. Ask admitted patients how they were described your facility. Gaps between what referrers say and what patients expect reveal communication breakdowns.
- Declined referral follow-ups. Contact the referring source after a declined referral to explain why the patient did not meet criteria. This feedback loop reduces repeat mismatches.
- Referrer relationship reviews. Assess whether a referring partner’s patient population has shifted. A hospital that previously sent post-surgical rehab patients may now be sending a different acuity mix.
Qualitative insights also reveal alignment gaps that numbers alone miss. A referral source may show a strong conversion rate for three months, then drop sharply. The metric flags the problem, but only a conversation with the referring case manager reveals that a new discharge coordinator joined and was never briefed on your clinical criteria. Fixing that gap costs nothing and restores the source’s performance.
Pro Tip: Build a short, five-question survey for referring partners and send it quarterly. Keep it under three minutes to complete. Response rates above 60% are achievable when you frame it as a partnership check-in rather than a performance review.
Healthcare administrators who want to grow their referral base through digital channels can also benefit from healthcare SEO strategies that increase facility visibility among referring providers.
Step-by-step process for scoring and tiering referral sources
A repeatable scoring process removes guesswork from referral quality assessment. The goal is to assign each referral source a tier based on objective criteria, then connect that tier to specific intake decisions.
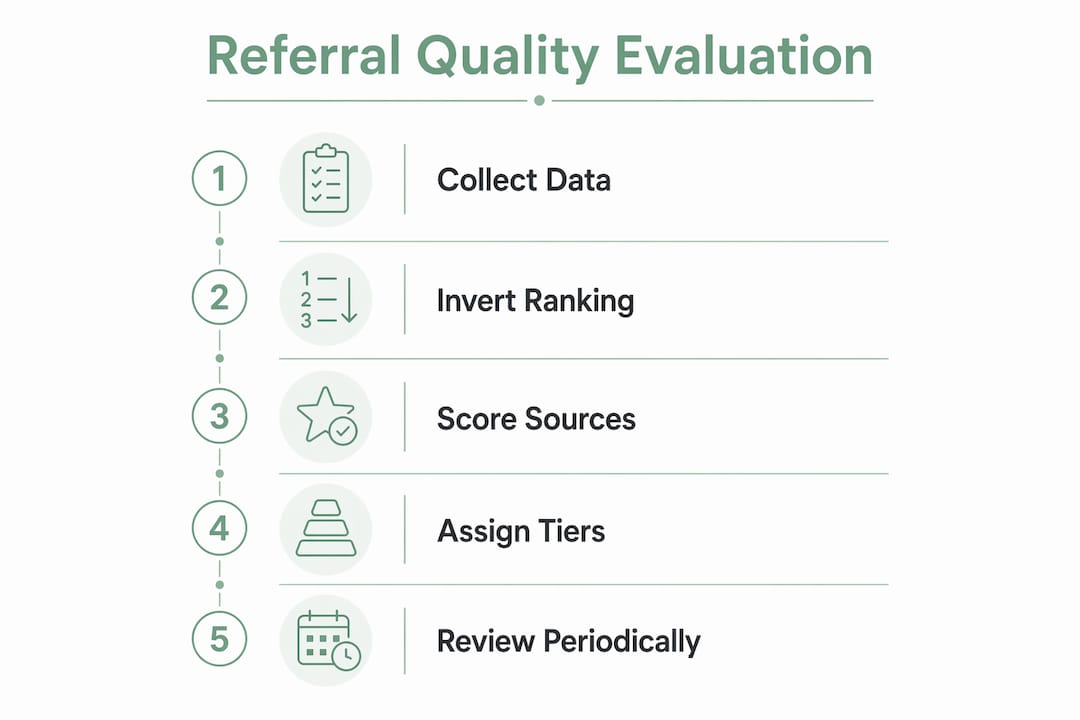
Step 1: Collect baseline data
Pull 90 days of referral data per source. Record total referrals received, referrals accepted, referrals admitted, time from referral to admission decision, and payer mix. Ninety days gives you enough volume to identify patterns without being skewed by a single month.
Step 2: Apply the inversion method
Most teams rank referral sources by volume. The inversion method flips that ranking by prioritizing engagement rate over raw numbers. A source sending 8 highly qualified referrals with a 75% conversion rate outranks a source sending 30 referrals with a 20% conversion rate. This method consistently surfaces high-value niche sources that volume-based rankings bury.
Step 3: Score each source across weighted dimensions
Use the following scoring framework:
| Evaluation dimension | Weight | What to measure |
|---|---|---|
| Conversion rate | 30% | Percentage of referrals that result in admission |
| Pipeline coverage contribution | 20% | Share of total qualified pipeline from this source |
| Patient retention at 90 days | 25% | Percentage of admitted patients still in care at 90 days |
| Payer mix quality | 15% | Ratio of Medicare/Medicaid to private pay referrals |
| Referrer alignment score | 10% | Qualitative rating from surveys and follow-up calls |
Step 4: Assign quality tiers
Map total scores to three tiers. Tier 1 sources (scores above 75%) receive priority response times and dedicated relationship management. Tier 2 sources (50–74%) receive standard processing with quarterly alignment calls. Tier 3 sources (below 50%) enter a 60-day improvement plan before your team decides whether to continue the relationship.
Pro Tip: Automate your tier assignments inside your referral management platform. When a source’s score crosses a threshold, trigger an automatic alert to your admissions coordinator. Manual tracking of tier changes leads to delays that cost you beds.
For a structured approach to managing which referrals get reviewed first, the referral prioritization process at Smartadmissions outlines five strategies your team can apply immediately.
Common pitfalls when assessing referral effectiveness
Even well-designed evaluation programs break down in predictable ways. Knowing the failure modes in advance lets your team build safeguards before problems appear.
Confusing volume with quality is the most widespread error. A high-volume source that sends poorly matched patients drains your intake team’s time and inflates your decline rate. Volume metrics belong in your dashboard, but they should never drive tier assignments on their own.
Ignoring time-to-close signals is equally costly. Referral quality deteriorates when intake time-to-close lengthens while close rates stay flat. That pattern indicates lower-intent referrals entering your pipeline. Your team should treat a lengthening time-to-close as an early warning signal, not a staffing problem.
Additional pitfalls to watch for:
- Mismatched ideal patient profiles. If your facility specializes in ventilator-dependent patients but a referring source consistently sends general rehab cases, no amount of process improvement will fix the mismatch. Address it at the relationship level.
- Overreliance on click-level signals. Initial referral volume and inquiry counts are easy to measure but weakly correlated with long-term value. Retention and ARPU carry more weight than early-stage signals when scoring for true referral quality.
- Infrequent threshold reviews. Benchmarks that made sense 12 months ago may not reflect your current payer mix or capacity. Review your scoring thresholds every six months.
“Effective referral quality scoring should combine multiple weighted dimensions tied to downstream revenue and retention, not just initial referral clicks or sign-ups. Facilities that score only on early-stage signals consistently overvalue low-intent sources and undervalue their best partners.”
Maintaining data integrity requires assigning one person on your team as the referral data owner. That person audits source records monthly, flags duplicate entries, and reconciles referral data against your EMR. Without a named owner, data drift accumulates and your scoring model loses accuracy over time. Improving intake efficiency depends directly on the quality of the data feeding your evaluation process.
Key Takeaways
Evaluating referral quality requires combining weighted KPIs, qualitative partner feedback, and a tiered scoring system to consistently identify which sources drive admissions and which drain resources.
| Point | Details |
|---|---|
| Set a conversion rate floor | Sources with conversion rates below 35% likely misunderstand your clinical criteria and need realignment. |
| Use the inversion method | Rank referral sources by engagement rate, not volume, to surface high-value niche partners. |
| Combine quantitative and qualitative data | Dual-framework programs are 2.3 times more likely to optimize referral outcomes successfully. |
| Monitor time-to-close as a quality signal | A lengthening time-to-close with flat close rates signals lower-intent referrals entering your pipeline. |
| Assign a data owner | One named team member should audit referral source records monthly to prevent scoring drift. |
Why referral quality evaluation is the most underused admissions tool
After working with healthcare admissions teams across skilled nursing and post-acute care settings, I keep seeing the same pattern. Facilities invest heavily in building referral relationships but almost nothing in measuring whether those relationships are actually performing. The result is a pipeline that looks full but converts poorly.
The facilities that outperform their peers on bed occupancy are not necessarily the ones with the most referral sources. They are the ones that know exactly which sources to prioritize on a Monday morning when two beds open simultaneously. That knowledge comes from a scoring system built on real data, not intuition.
Word-of-mouth influences 20% to 50% of purchasing decisions across industries, and healthcare referrals operate on the same principle. The referring case manager who trusts your facility sends you their best-fit patients first. Building that trust requires you to close the feedback loop, which means telling referrers when their patients are a strong match and when they are not. Most facilities never do this. The ones that do see their Tier 1 source conversion rates climb steadily within two quarters.
My conviction is that referral quality evaluation is not a reporting exercise. It is a relationship management discipline. The metrics give you the language to have honest conversations with your referral partners. Those conversations are what actually move the needle.
— Harry
Smartadmissions makes referral quality assessment repeatable
Healthcare admissions teams that track referral quality manually spend hours each week pulling data from disconnected systems. Smartadmissions changes that by centralizing referral intake, KPI tracking, and partner performance data inside a single AI-powered platform built for skilled nursing facilities, rehabilitation centers, and post-acute care providers.
The platform integrates with your existing EMR and insurance portals to deliver real-time eligibility verification and clinical assessments at the point of referral review. Your team gets the data needed to score and tier referral sources without building spreadsheets from scratch. Explore referral management system examples to see how facilities like yours have structured their evaluation workflows, or review the referral tracking guide to understand how better tracking directly supports higher bed occupancy.
FAQ
What is referral quality in healthcare admissions?
Referral quality is the degree to which an incoming patient referral matches a facility’s clinical criteria, payer requirements, and available capacity. High-quality referrals convert to admissions at higher rates and produce better patient retention outcomes.
What conversion rate signals a low-quality referral source?
Referral sources with introduction-to-qualified-opportunity conversion rates below 35% typically lack alignment with your ideal patient profile or clinical requirements. That threshold is the minimum acceptable benchmark for a productive referral relationship.
How do you evaluate referral sources without enough volume data?
Apply the inversion method: rank sources by engagement rate and qualitative alignment rather than raw referral count. Small sources with high conversion rates and strong referrer survey scores often outperform high-volume sources with poor clinical fit.
How often should referral quality thresholds be reviewed?
Review scoring thresholds every six months to account for changes in your payer mix, clinical specialization, or capacity. Thresholds set more than 12 months ago may no longer reflect your current admissions targets.
What is the fastest sign that referral quality is declining?
A lengthening time-to-close combined with flat close rates is the earliest detectable signal of quality degradation. That pattern indicates lower-intent referrals entering your pipeline before volume metrics show any change.