
Denial risk scoring assigns each claim a probability of denial and flags the likely reason, so your team can fix problems before the claim goes out. The urgency is real: 99% of Medicare Advantage enrollees sit in plans that require prior authorization on some services, and, according to the AMA, physicians complete an average of 39 requests per week.
TL;DR:
- Train models on two to three years of your own claims with denial outcomes; plan specific history outperforms national averages when authorization rules vary.
- Pair each denial probability with its predicted reason and supporting fields, then route eligibility, coding, and medical necessity issues to the right specialists.
- Pilot with one high volume payer and one denial category, baseline clean claim rates and write offs, then compare matched periods before expanding.
- Treat reported gains of 2–5% in clean claims, 25–50% fewer write offs, and 2–5 fewer A/R days as illustrative, not guaranteed.
Table of Contents
- 1. Why denial risk scoring matters for your revenue-cycle team
- 2. How do risk scoring models work, and why does interpretability matter?
- 3. What data inputs does reliable scoring require?
- 4. How do you implement scoring in five steps?
- 5. Which metrics prove the impact?
- 6. Our view: score transparently and keep humans in the loop
- 7. How Smart Admissions helps intake teams prevent denials
- FAQ
- Sources
1. Why denial risk scoring matters for your revenue-cycle team
Prior authorization is the clearest pressure point. According to KFF’s Medicare Advantage analysis, physicians dedicate 13 staff hours per week to prior authorization work, and 89% of surveyed physicians say it contributes to burnout. Meanwhile, the AMA notes that rising denial rates are increasingly tied to payers’ use of predictive and automated decision tools.
Most denials trace back to a short list of controllable causes, as the Defense Health Agency’s denials webinar describes:
- Eligibility problems and incorrect demographics
- Failure to obtain prior authorization
- Coding errors
- Non-covered benefits
- Untimely filing
The strategic shift is from appeals to prevention. AHIMA’s guidance describes effective denial management as submitting clean claims by fixing root causes such as front-end eligibility checks and clinical documentation errors. For teams that want a process to anchor this, our denials management process guide offers a practical resource.
2. How do risk scoring models work, and why does interpretability matter?
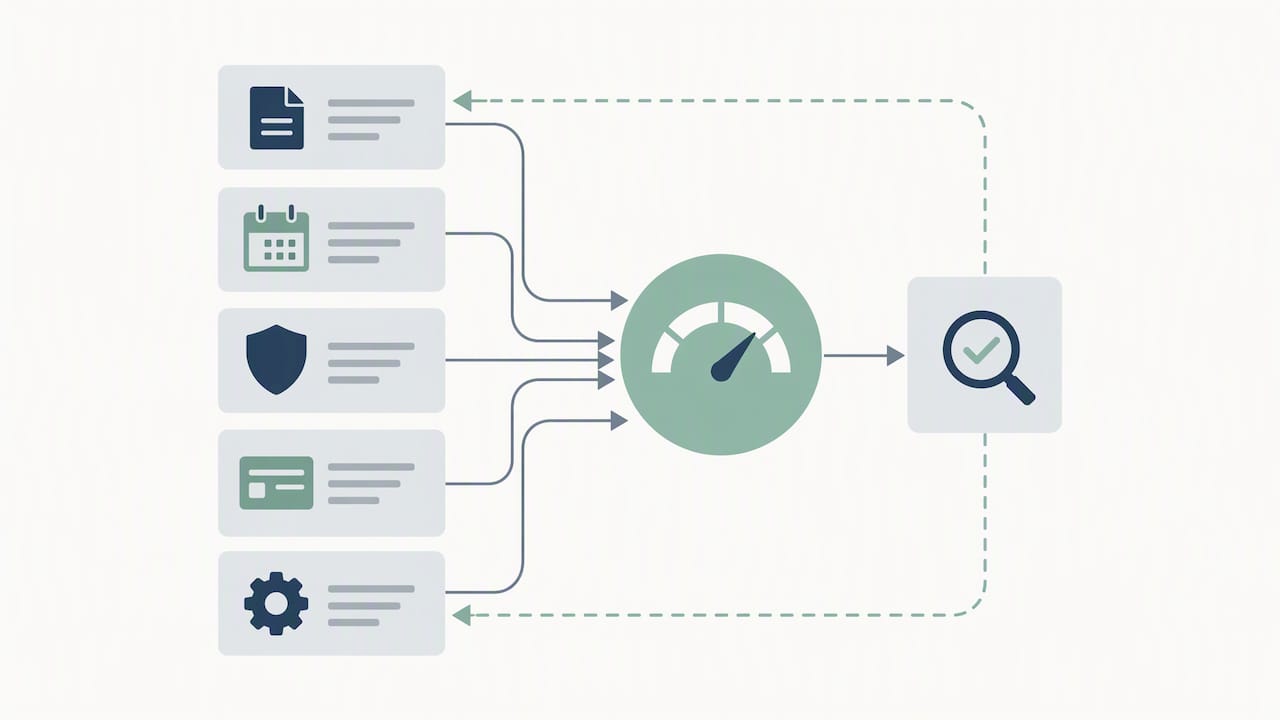
A scoring design can combine deterministic matching, using rules and CARC/RARC patterns to flag known issues, with a machine learning classifier that estimates denial probability for claims the rules cannot resolve. The Digital Scientists denial prediction framework describes this kind of claim-level modeling built on claim characteristics, payer patterns, provider patterns, documentation signals and timing.
A score alone does not move work. Two outputs matter:
- Probability of denial: how likely this claim is to be denied as currently built.
- Predicted reason: the specific issue (eligibility, coding, authorization, documentation) that should decide who gets the claim.
AHIMA practitioners make the same point: a score is useful only when it carries the predicted reason and routes to the right specialist, and an opaque high score with no context just creates noise. Accuracy also depends on your own history. Models trained on generic data underperform, so the framework calls for your organization’s claims with denial outcomes attached.
Pro Tip: Show the two or three fields that drove each score right next to it. Staff who can verify the signal in seconds trust the model and act on it.
3. What data inputs does reliable scoring require?
Scoring quality is capped by the data feeding it. According to the Digital Scientists framework, a practical model typically needs two to three years of historical claims with denial outcomes. Gather these groups of signals:
- Claim-level fields: CPT/HCPCS codes, ICD-10 diagnoses, modifiers, place of service and dates of service.
- Payer and plan signals: historical denial rates, CARC/RARC patterns and plan-level rules. Plan rules differ widely, and the AMA has flagged how ERISA plans apply prior authorization inconsistently, which is exactly why plan-specific history beats national averages.
- Provider and coder signals: provider and coder IDs with their historical denial patterns.
- Operational signals: prior authorization status, EHR documentation completeness and eligibility verification timestamps. Our documentation management guide covers how complete documentation reaches the claim.
- Training labels: denial outcomes, appeal results, adjudication timestamps and reason codes.
Upstream validation matters too. X12 guidance on missing 837 data shows that missing or malformed required fields trigger syntax rejections before adjudication even begins.
4. How do you implement scoring in five steps?
Follow this sequence to pilot and scale:
- Design the pilot. Pick a claim sample and duration, then baseline clean claim rate, denial write-offs and appeal overturn rate before you start.
- Integrate. Connect the EHR/EMR, claim submission pipeline, eligibility system, denials tracker and reporting dashboards. Our prior authorization automation resource covers the authorization touchpoints.
- Route by predicted reason. Send medical necessity to clinical review, coding errors to coders, and eligibility to the front desk or admissions. Set an SLA for each queue.
- Retrain and govern. Capture corrected-submission outcomes, retrain on them, and review for model drift as payer rules change.
- Manage the change. Train staff, standardize documentation templates and keep a denials action plan. AHIMA’s denials action plan recommends a denials database with reason-code profiles, payer and provider profiles, and routine trending.
Pro Tip: Start with one high-volume payer and one denial category. A narrow pilot produces a clean before-and-after comparison faster than a facility-wide rollout.
For more operational detail, see our playbook on how to reduce admission denials.
5. Which metrics prove the impact?
Track these KPIs from day one of the pilot:
- Initial clean claim rate
- Denial write-offs
- Overturn and appeal success rate
- Days in A/R
- Time to resolution
The HFMA denial prevention concepts recommend standardized visualization and categorizing denials as controllable, medical necessity or uncontrollable, so improvements land in the right bucket.
Example cases in the Digital Scientists framework show a 2–5% clean-claim improvement, a 25–50% reduction in denial write-offs and a 2–5 day reduction in A/R days. Treat these as illustrative ranges, not guarantees.
To validate your own pilot, compare matched pre-pilot and pilot periods, test the difference in denial rate for statistical significance, then multiply the write-off reduction by your annual denied dollars to project revenue impact.
6. Our view: score transparently and keep humans in the loop
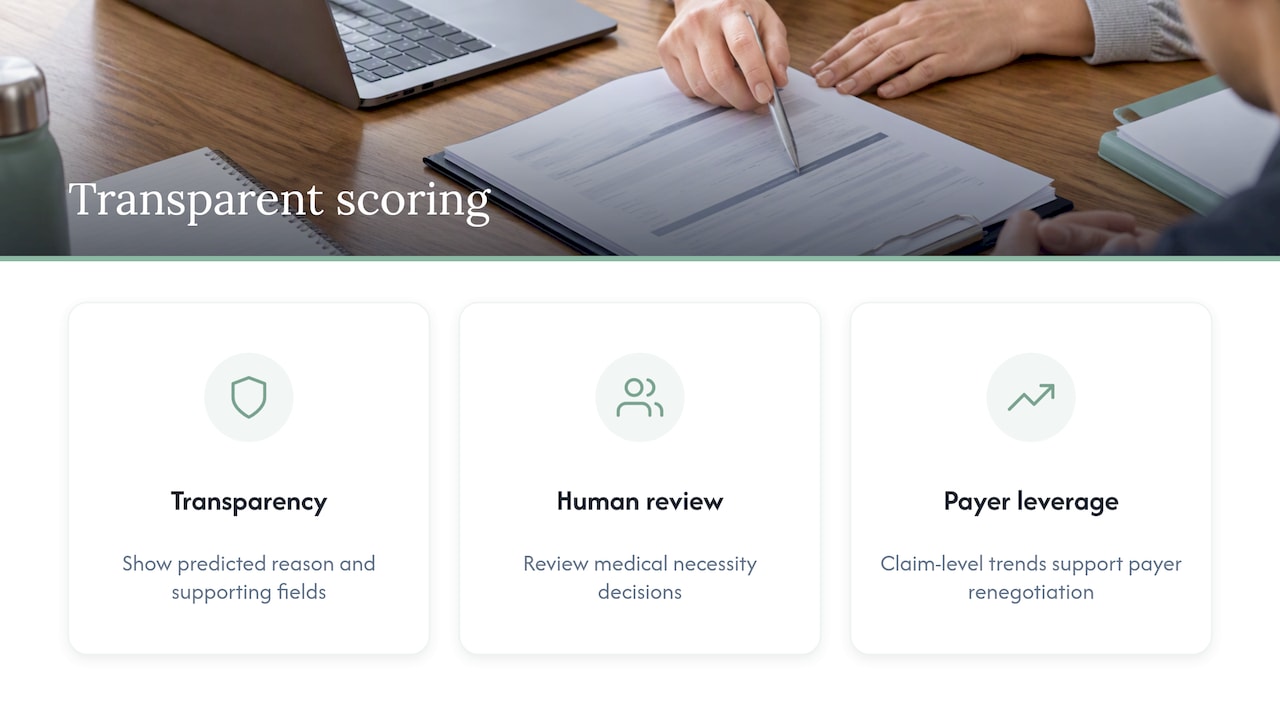
We believe denial risk scoring earns trust only when it is transparent. Surface the predicted reason and supporting fields so clinicians and billers can verify every correction, and keep human review in place for medical necessity decisions, with a documented decision trail. The AMA’s concerns about automated payer decision tools apply to providers too: opaque automation is a problem on either side of the claim.
Scoring also gives you leverage. Systematic denial trends, documented claim by claim, support payer renegotiation, and Kevin Watson Barron frames scoring as a bridge between patient access, documentation and payer contracting. That evidence is also what gold-carding conversations need.
— Harry
7. How Smart Admissions helps intake teams prevent denials
Some denials may stem from admission and intake issues. Our platform is designed to support eligibility checks, documentation review and intake workflows. Contact us to learn how it may fit your process. Read how real-time eligibility verification works, or see our pricing: Monthly is $597 per month and Annually is $6,447 per year. Contact us to discuss how it may fit your process.
FAQ
What is a 277 rejection in medical billing?
A 277CA rejection typically occurs before payer adjudication because of syntax or editing errors. It differs from an 835 remittance denial, which happens during adjudication, as X12 guidance explains.
What are the most common causes of claim denials?
Eligibility problems, missing prior authorization, coding errors, non-covered benefits, untimely filing and incorrect demographics lead the list. Most are controllable with early intervention at intake and registration.
How much history does a denial prediction model need?
A practical model typically needs two to three years of historical claims with denial outcomes, per the Digital Scientists framework. Training on your own organization’s data keeps predictions accurate.
Does a risk score help without a predicted reason?
Not much. A score becomes actionable when it names the likely reason and routes the claim to the right specialist, such as a coder, clinician or front desk.
Sources
- Kff
- It is time to make prior authorization reform a reality | American Medical Association
- Claim Denial Prediction AI | Healthcare AI Framework | Digital Scientists
- RFI # 1942: Clarification STC01-1 in 277CA | X12