
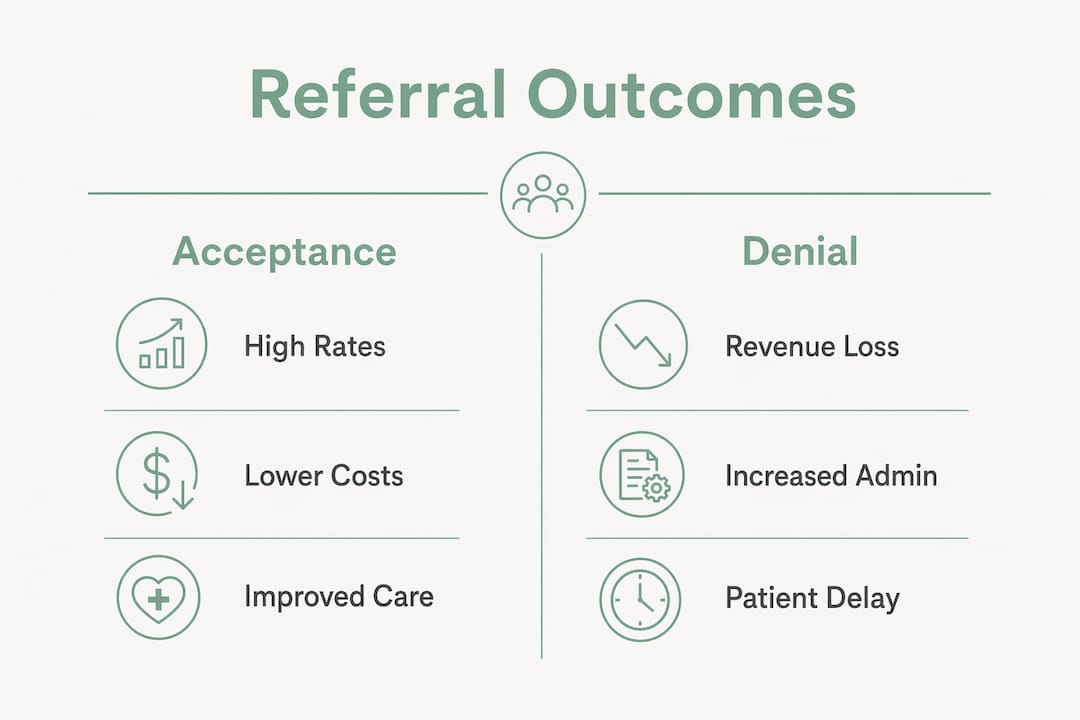
Tracking referral acceptance versus denial rates is one of the highest-leverage decisions your admissions team can make. When a referral is accepted, your facility gains a patient, revenue, and a care coordination opportunity. When it is denied, you lose all three, and often without knowing exactly why. Without measurement, denial patterns stay invisible and repeat indefinitely.
Here is why these metrics belong at the center of your operational reporting:
- Revenue protection. Referral leakage can reach 35% without proper tracking, impacting fee-for-service revenue and quality bonuses under value-based contracts.
- Quality score accountability. Referral completion rates feed directly into HEDIS measures and Medicare Star Ratings, both of which affect your facility’s reimbursement and public reputation.
- Operational visibility. Measuring denial reasons tells you whether the problem is documentation, payer mismatch, capacity, or specialty fit, so your team can fix the right thing.
- Care continuity. Untracked denials mean patients fall through the gaps between providers, delaying treatment and increasing readmission risk.
- Benchmarking readiness. You cannot compare your performance against industry standards or set realistic improvement targets without a baseline denial rate.
- Compliance confidence. Referral tracking supports audit readiness under CMS and HIPAA requirements, giving your compliance team a defensible paper trail.
Measurement is not just a reporting exercise. It is the foundation for every improvement your facility makes to its referral workflow.
What causes referral denials at your facility?
Understanding why referrals get denied is the first step toward reducing them. The causes are rarely random. They cluster around a predictable set of operational and clinical gaps that your team can address once you know where to look.
The most common drivers include:
- Insurance and network mismatches. A referral sent to an out-of-network specialist or facility is almost certain to be denied. Incomplete documentation and payer mismatches are among the leading causes of avoidable administrative burden across US healthcare facilities.
- Missing clinical documentation. Labs, imaging results, prior authorization numbers, and clinical notes are frequently absent from referral packets. Specialists and payers reject incomplete submissions rather than chase down the missing pieces.
- Inappropriate specialty matching. Sending a patient to the wrong specialist type, such as a general internist when a wound care specialist is needed, results in denial and delays the patient’s care by days or weeks.
- Capacity constraints at the receiving facility. Even a well-prepared referral can be declined when the receiving provider has no available appointments or beds. Tracking these denials separately helps you identify capacity bottlenecks versus documentation failures.
- Outdated provider directories. Referrals built on stale directory data, wrong phone numbers, closed panels, or retired providers, generate denials that have nothing to do with clinical appropriateness.
- Lack of prior authorization. Many payers require pre-authorization before a specialist visit or post-acute admission. Skipping this step is one of the most preventable denial causes your team faces.
- Multiple or duplicate referrals. Sending redundant referrals for the same patient creates confusion at the receiving end and can trigger automatic rejection by payer systems flagging duplicate claims.
Each denial type demands a different fix. A capacity denial calls for network expansion; a documentation denial calls for a pre-submission checklist. Grouping your denials by root cause is what turns raw data into a corrective action plan.

How referral denial rates affect your revenue and daily operations
The financial stakes of referral denials are concrete and measurable. Referral leakage costs the US healthcare system an estimated $150 billion annually, with key loss points at documentation gaps, eligibility failures, authorization delays, and scheduling breakdowns. For a skilled nursing facility or post-acute care provider, even a modest improvement in acceptance rates translates directly into higher bed occupancy and steadier cash flow.
Under fee-for-service models, a denied referral is straightforward lost revenue. The patient goes elsewhere, the bed stays empty, and your facility absorbs the administrative cost of the failed submission. Under value-based contracts, the damage compounds. Referral denials degrade Medicare Advantage Star Ratings, which directly reduces bonus payments your facility depends on to offset thin margins.
Operationally, high denial rates create a cascade of manual rework. Your admissions coordinators spend time resubmitting packets, chasing payer responses, and updating referring physicians, hours that could go toward processing new referrals. Facilities that do not track denial rates often discover that a disproportionate share of staff time is consumed by a small number of recurring, preventable denial types.
$150 billion in annual US healthcare losses are attributed to referral leakage, with documentation gaps and authorization delays among the primary contributors.
Improved acceptance rates reduce downstream costs as well. Fewer resubmissions mean lower administrative overhead. Faster admissions mean shorter revenue cycles. And when your facility consistently accepts clean referrals, referring physicians send more volume your way, compounding the financial benefit over time.
7 proven methods to measure referral acceptance versus denial
Measuring referral acceptance versus denial effectively requires a defined set of metrics, reliable data sources, and a consistent review cadence. Here is a practical framework your team can implement.
Core metrics to track
Key referral performance metrics include referral acceptance rate, denial rate, closed-loop rate, time to first appointment, and in-network retention rate. Each metric answers a different operational question.
| Metric | Definition | Target Benchmark |
|---|---|---|
| Referral acceptance rate | Percentage of referrals accepted by your facility or a receiving provider | Above 80% |
| Referral denial rate | Percentage of referrals rejected at any stage | — |
| Closed-loop rate | Percentage of referrals with confirmed appointment or admission | — |
| Time to first contact | Hours from referral receipt to initial patient contact | — |
| In-network retention rate | Percentage of referrals kept within your contracted network | Facility-specific target |
Data sources for accurate measurement
Your EHR system, scheduling platform, payer portals, and referral tracking software each hold pieces of the picture. Pulling data from a single source gives you an incomplete view. Integrating EHR data with payer authorization records and scheduling logs is what produces a reliable denial rate you can act on.
Measurement cadence
- Weekly: Review new denials by reason code and assign corrective action.
- Monthly: Analyze acceptance and denial rate trends by payer, specialty, and referring source.
- Quarterly: Benchmark your rates against industry targets and adjust workflows accordingly.
- Annually: Audit your provider directory for accuracy and update payer contract terms.
Pro Tip: Start with denial reason codes. Sorting denials by root cause, documentation, authorization, network, or capacity, reveals which process fix will have the largest immediate impact on your acceptance rate.
Consistency matters more than sophistication. A simple spreadsheet reviewed weekly beats a complex dashboard checked quarterly. Once your team builds the habit of reviewing denial data regularly, you can track referral outcomes with increasing precision and connect the findings to specific workflow changes.
How referral measurement improves clinical quality and care coordination
Measuring referral outcomes does more than protect revenue. It directly improves the care your patients receive. When your team tracks whether referrals are accepted, scheduled, and completed, you create a closed-loop system that catches patients before they fall out of the care continuum.

Closed-loop referral management enhances care continuity metrics like HEDIS and improves total cost of care under value-based models. HEDIS measures such as follow-up after hospitalization and diabetes care completion depend on referral completion data. Facilities that track these loops consistently score higher on quality reporting, which feeds into Star Ratings and CMS performance programs.
The clinical benefits of tracking referral outcomes include:
- Earlier identification of care gaps. When a referral goes unacknowledged for 48 hours, your team can intervene before the patient misses a critical appointment.
- Better specialist relationships. Specialists prioritize referring practices with clean, complete referrals, raising acceptance rates and building a positive referral network over time.
- Reduced readmissions. Patients who complete specialist referrals after discharge are less likely to return to the hospital within 30 days, a metric that directly affects your facility’s CMS penalties.
- Improved care appropriateness. Tracking denial reasons for specialty mismatch helps your clinical team refine referral criteria, so future referrals go to the right provider the first time.
- Regulatory compliance support. Documented referral outcomes provide evidence of care coordination for CMS audits, Joint Commission reviews, and HIPAA compliance requirements.
The feedback loop works in both directions. When your admissions team shares referral outcome data with clinical staff, physicians adjust their referral patterns based on what actually gets accepted. That alignment between clinical decision-making and operational reality is what reduces referral times and improves patient flow across your facility.
What the research says about referral management automation
Automation is changing what is operationally possible in referral management. The evidence is consistent: facilities that automate front-end eligibility checks, documentation assembly, and specialty matching see fewer denials and faster admissions.
Automation reduces manual coordination substantially and identifies referral denials in real time, enabling your team to correct errors before a rejection is issued. That shift from reactive to proactive denial management is the core operational advantage of AI-assisted referral tools.
Key automation capabilities that directly affect acceptance rates include:
- Real-time eligibility verification. Checking payer coverage at the point of referral submission prevents network mismatch denials before they occur.
- Documentation completeness checks. Automated pre-submission audits flag missing labs, imaging, or authorization numbers so your staff can resolve gaps immediately.
- Specialty matching logic. AI-driven tools match patient diagnoses to the appropriate specialist type, reducing inappropriate referral denials.
- Real-time denial alerts. When a payer or receiving facility issues a denial, automated systems surface the reason code instantly rather than waiting for a fax or phone call.
- Closed-loop tracking. Automation confirms appointment scheduling and admission status, closing the referral loop without manual follow-up calls.
Practices using automated referral tools report up to 80% less manual coordination time and can detect denials immediately at the point of send, according to AI referral automation research.
The revenue protection benefit is equally direct. Facilities that catch documentation errors before submission avoid the administrative cost of resubmission and the revenue delay of a denied claim. Over a month of referral volume, those prevented denials add up to measurable bed-days recovered. Platforms like Smartadmissions integrate with your existing EHR and payer portals to automate these checks at scale, giving your admissions team real-time visibility into every referral’s status without adding manual steps to their workflow. You can explore how referral management systems support these capabilities in practice.
How payer policies and authorization requirements drive referral denials
Payer policies are one of the most consequential and least controllable factors in referral denial rates. Understanding how authorization requirements work, and where they most often cause denials, gives your team a clear target for process improvement.
Most commercial payers and Medicare Advantage plans require prior authorization for specialist visits, post-acute admissions, and certain diagnostic procedures. When your team submits a referral without the required authorization, the denial is automatic, regardless of clinical appropriateness. The authorization requirement itself is not the problem. The problem is when your workflow does not surface that requirement before the referral goes out.
Payer networks add a second layer of complexity. A specialist who was in-network last quarter may have left the network this quarter. Without a real-time directory check at the point of referral, your team is working from outdated information. Referring providers consider insurance acceptance a meaningful factor when selecting specialists, and network status mismatches are a consistent source of preventable denials across US healthcare settings.
Authorization timelines also create operational friction. Many payers require 3–5 business days to process a prior authorization request. For post-acute admissions where a patient is ready for discharge today, that delay can mean a lost referral if the receiving facility fills the bed with another patient. Tracking authorization turnaround times as part of your referral metrics helps you identify which payers consistently create bottlenecks and plan accordingly.
A few practices that reduce payer-related denials:
- Maintain a payer-specific authorization matrix updated at least quarterly.
- Verify network status for every specialist at the time of referral, not at the time of scheduling.
- Submit authorization requests concurrently with clinical documentation rather than sequentially.
- Track denial reason codes by payer to identify which contracts generate the most friction.
Payer policy changes are ongoing. CMS updates Medicare Advantage authorization rules periodically, and commercial payers adjust their formularies and network compositions throughout the year. Building a process to monitor these changes, rather than reacting to denials after the fact, keeps your acceptance rate stable even as the payer environment shifts.
Key Takeaways
Measuring referral acceptance versus denial rates gives healthcare facilities the data they need to protect revenue, improve care quality, and reduce avoidable administrative work.
| Point | Details |
|---|---|
| Leakage can be significant without tracking | Unmonitored referral workflows lose a substantial portion of referrals, directly cutting bed occupancy and revenue. |
| Referral leakage costs the US healthcare system $150 billion per year, driven by documentation and authorization failures. | Referral leakage costs the US healthcare system $150 billion per year, driven by documentation and authorization failures. |
| Benchmark targets are clear | High-performing facilities target acceptance rates above 80%, closed-loop rates above 70%, and first contact times under 24 hours. |
| Automation cuts manual work by up to 80% | AI-assisted referral tools reduce manual coordination time by up to 80% and catch denials at the point of submission. |
| Closed-loop tracking supports HEDIS and Star Ratings | Tracking referral completion feeds quality measures that directly affect Medicare bonus payments and CMS performance scores. |