
TL;DR:
- Cost per referral measures the average investment needed to generate a successful patient referral. Healthcare facilities should track CPR regularly to evaluate referral program efficiency and guide budget decisions.
Cost per referral (CPR) is defined as the average total investment your facility makes to generate each successful patient referral. Healthcare administrators use this metric to measure referral program efficiency, benchmark spending against industry standards, and make informed decisions about patient acquisition budgets. The 2026 industry benchmark places average CPR at $28–$32, far below the $119 average cost of paid advertising channels. Understanding what is a cost per referral metric gives your admissions team a clear financial lens for evaluating every referral source, incentive structure, and intake workflow your facility relies on.
What is the cost per referral metric in healthcare?
Cost per referral (CPR) is the standard industry term for measuring referral acquisition efficiency. The metric answers one direct question: how much does it cost your facility to bring in one referred patient? CPR captures every dollar spent on your referral program divided by the number of referrals that result in an actual admission.
The standard CPR formula is straightforward: Total Referral Program Costs ÷ Number of Successful Referrals = CPR. Industry benchmarks classify a CPR below $15 as excellent, while the average range sits between $30 and $50. Knowing where your facility lands on that scale tells you whether your referral program is financially healthy or quietly draining resources.
CPR matters because referral programs are not free to run. Incentives, software subscriptions, marketing materials, and staff time all carry real costs. Without tracking CPR, your team has no way to tell whether a referral source is profitable or simply busy. The metric turns volume data into financial intelligence.
Defining referral cost metrics also helps your facility compare acquisition channels with a common unit of measurement. A referral source generating 20 admissions per month at a CPR of $40 may outperform a paid advertising campaign generating 25 admissions at $119 each. CPR makes that comparison concrete.
How is cost per referral calculated in healthcare settings?
Accurate CPR calculation requires capturing every cost category that touches your referral program. Facilities that track only incentive payments routinely underestimate their true acquisition cost, which distorts budgeting and ROI analysis.
The full cost components to include are:
- Referral incentives — payments, gifts, or rewards given to referring physicians, discharge planners, or partner facilities.
- Software and technology fees — monthly or annual costs for referral management platforms, EMR integrations, and insurance verification tools.
- Marketing and outreach costs — printed materials, events, liaison travel, and digital campaigns targeting referral sources.
- Administrative staff time — hours spent by admissions coordinators reviewing, documenting, and following up on referrals.
- Clinical validation time — time clinical staff spend assessing patient acuity and confirming clinical fit before accepting a referral.
Administrative overhead is the cost category most often excluded from CPR calculations in healthcare settings. That omission causes facilities to believe their referral programs are cheaper than they actually are, leading to poor budget decisions and inaccurate ROI reporting.
Example calculation: If your facility spends $8,000 per month on incentives, $1,200 on software, $600 on marketing, and $2,200 on staff time, your total monthly referral program cost is $12,000. If that investment produces 350 successful referrals, your CPR is $34.28. That figure sits within the average industry range.

Track CPR monthly for operational management and quarterly for strategic review. Monthly tracking catches cost spikes early. Quarterly analysis reveals trends that single months can obscure.
Pro Tip: Always assign a dollar value to clinical staff time spent on referral documentation. If a nurse practitioner spends 15 minutes per referral on clinical review, that time has a measurable cost. Excluding it makes your CPR look artificially low and your program look more efficient than it is.
How does cost per referral compare to other patient acquisition costs?
Referral programs are the most cost-efficient patient acquisition channel available to most post-acute care facilities. The numbers make the case clearly.
Referral programs reduce acquisition costs by 30–60% compared to paid advertising channels. At an average CPR of $28–$32 versus $119 for paid advertising, the financial advantage is not marginal. It is structural.
The efficiency advantage extends beyond the initial acquisition cost. Referred patients deliver measurably better long-term financial outcomes:
- Referred patients generate 15–25% higher lifetime value compared to non-referred patients.
- Referred patients show 18% lower churn rates, meaning they stay longer and require fewer re-acquisition efforts.
- Referral programs that reach a referral share rate above 15% are classified as best-in-class by industry benchmarks.
The table below compares key acquisition channels across cost and outcome dimensions.
| Acquisition channel | Average cost per admission | Patient retention advantage | Long-term value |
|---|---|---|---|
| Referral program | $28–$32 | High (18% lower churn) | 15–25% higher LTV |
| Paid advertising | $119 average | Standard | Standard |
| Organic/direct inquiry | Variable, often low | Moderate | Moderate |
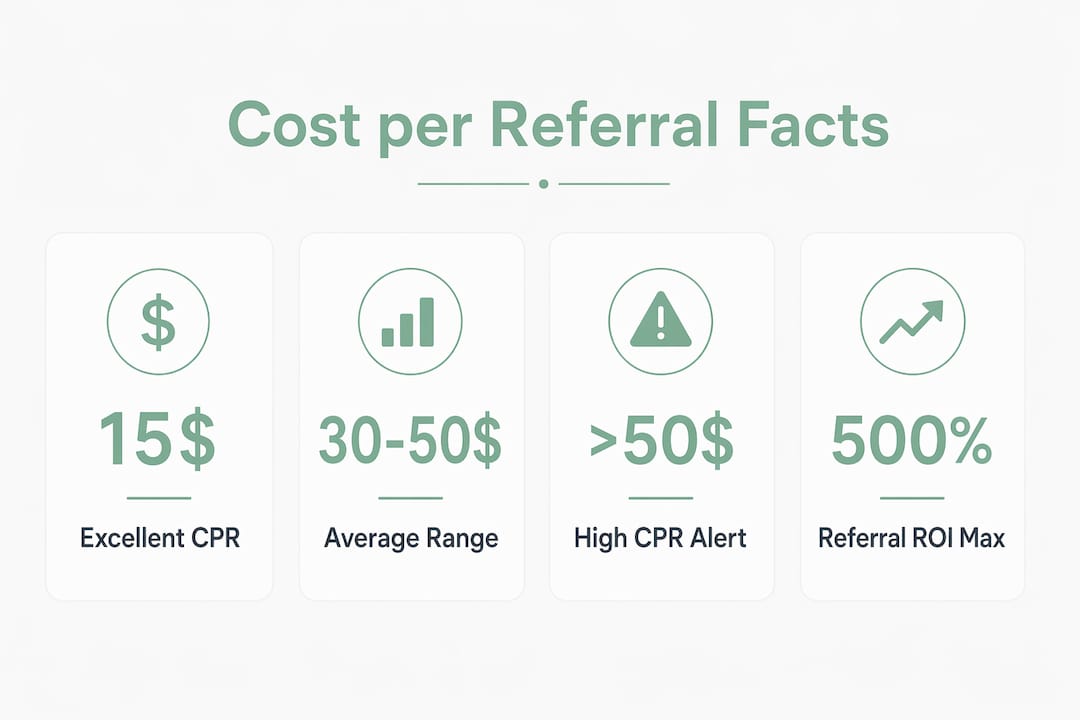
Referral ROI goes further than CPR alone. Referral ROI can exceed 500% in top-performing facilities. That figure reflects the full revenue generated by referred patients over their stay, divided by total program costs. CPR tells you what you spent. Referral ROI tells you whether it was worth it.
Pro Tip: Use CPR as your efficiency signal and referral ROI as your profitability signal. Neither metric alone gives you the full picture. Run both every quarter.
Tracking referral conversion rates alongside CPR gives your team a complete view of where referrals are being lost and where acquisition costs are rising unnecessarily.
What nuances should administrators consider when interpreting cost per referral?
A low CPR is not always good news. A high CPR is not always a problem. The metric requires context to be useful.
A higher CPR is justified when the referred patients have higher acuity, longer average stays, and greater total revenue per admission. A skilled nursing facility that pays $55 per referral for complex post-surgical patients generating $18,000 in revenue per stay is in a far stronger financial position than one paying $20 per referral for short-stay patients generating $4,000 each. CPR must always be read alongside patient lifetime value (LTV).
The payback period concept adds another layer of precision. Tracking the payback period of referred patients relative to CPR cost tells you how quickly your facility recovers its acquisition investment. If a patient’s average stay generates revenue within the first two weeks, and your CPR is $34, your payback period is short and your program is financially sustainable. If the payback period exceeds the average stay length, your program is losing money on each referral regardless of volume.
Your referral funnel health also shapes CPR trends over time. Watch for these signals:
- Rising CPR without referral volume growth signals workflow bottlenecks or declining advocate participation rates. Rising CPR trends indicate it is time to audit your referral intake process.
- Stable CPR with declining referral volume suggests your referral sources are disengaging, not that your costs are under control.
- Falling CPR with stable volume is the target outcome. It means your process is becoming more efficient without sacrificing referral quality.
Centralized referral tracking gives your team the data visibility needed to catch these signals before they become financial problems. Facilities that monitor CPR in isolation, without connecting it to funnel health and LTV, consistently misread their program’s performance.
Pro Tip: Set a CPR ceiling as a percentage of your average referred patient’s LTV. If your average referred patient generates $12,000 in revenue, a CPR ceiling of 0.5% of LTV equals $60. That gives your team a financially grounded upper limit, not an arbitrary number.
How can facilities apply cost per referral data to improve admissions performance?
CPR data becomes operationally useful only when your team acts on it systematically. Tracking the number without changing behavior produces no financial improvement.
-
Benchmark your CPR against industry standards. A CPR below $15 is excellent. Between $30 and $50 is average. Above $50 warrants a cost audit. Use industry benchmarks as your starting reference point, then set facility-specific targets based on your patient mix and revenue per admission.
-
Integrate referral tracking with your admissions workflow software. Manual tracking introduces errors and delays that inflate administrative costs. Platforms that connect referral intake with EMR systems and insurance verification reduce the staff time component of CPR directly. Automation in healthcare admissions is one of the fastest ways to lower CPR without cutting referral quality.
-
Review CPR monthly and adjust quarterly. Monthly reviews catch cost spikes tied to specific referral sources or incentive changes. Quarterly reviews reveal structural trends. Adjust incentive structures, marketing spend, and staffing allocations based on what the data shows, not on assumptions.
-
Automate referral intake documentation. Reducing manual referral handling time directly lowers the administrative cost component of CPR. Facilities that automate documentation review, eligibility verification, and clinical assessment routing cut hidden soft costs that most CPR calculations miss entirely.
-
Set CPR targets as a percentage of referred patient CLV. Customer lifetime value (CLV) in healthcare equals the total revenue a patient generates across their stay and any subsequent admissions. Tying your CPR ceiling to CLV keeps your acquisition spending proportional to the revenue each referral source actually delivers.
Facilities that apply staff efficiency improvements to their admissions process consistently see CPR reductions without sacrificing referral volume or quality. The financial gains compound over time as workflows become more efficient and staff time is redirected toward higher-value tasks. A healthcare automation case study from Camptra illustrates how operational improvements in healthcare financial processes translate directly into measurable cost reductions across administrative functions.
Key Takeaways
Accurate CPR calculation, combined with LTV and referral ROI analysis, gives healthcare administrators the financial clarity needed to run a profitable, sustainable referral program.
| Point | Details |
|---|---|
| CPR definition | CPR equals total referral program costs divided by the number of successful referrals. |
| 2026 benchmarks | A CPR below $15 is excellent; $30–$50 is average; above $50 warrants a cost audit. |
| Include soft costs | Administrative and clinical staff time must be included for an accurate CPR figure. |
| Context over raw numbers | A high CPR can be justified when referred patients have high acuity and long stays. |
| Automate to reduce CPR | Automating referral intake documentation directly lowers the administrative cost component. |
Why CPR is a diagnostic tool, not just a cost figure
Most admissions teams I have worked with treat CPR as a budget line. They look at the number, compare it to last quarter, and move on. That approach misses the real value of the metric entirely.
CPR is a diagnostic instrument. When it rises without a corresponding increase in referral volume, something is broken in your intake process. When it falls while referral quality drops, you may be cutting costs in ways that hurt patient outcomes and long-term revenue. The number alone does not tell you which problem you have. The trend, combined with funnel data and LTV analysis, does.
The facilities I have seen manage CPR most effectively treat it the way a clinician treats a vital sign. They monitor it continuously, investigate deviations immediately, and connect it to other indicators before drawing conclusions. They also invest in the tools that make continuous monitoring possible, because manual tracking at scale is simply not sustainable for a busy admissions team.
My honest advice: stop reviewing CPR once a quarter in a spreadsheet. Build it into your weekly admissions dashboard. Connect it to your referral source data, your average length of stay, and your revenue per admission. When those numbers move together, you will see the story your referral program is actually telling.
— Harry
Smartadmissions and referral cost management
Smartadmissions is built specifically for skilled nursing facilities, rehabilitation centers, and post-acute care providers that need to track and reduce referral acquisition costs without adding administrative burden.

The platform automates referral intake, clinical documentation, and insurance eligibility verification, which directly reduces the staff time component of CPR. Its analytics features give your admissions team real-time visibility into referral source performance, cost trends, and bed fill rates. Explore referral management system examples to see how facilities like yours have applied automation to lower CPR and improve financial outcomes. You can also review referral tracking strategies that connect CPR data directly to occupancy performance.
FAQ
What is the cost per referral metric in simple terms?
Cost per referral (CPR) is the total amount your facility spends on its referral program divided by the number of successful referrals generated. It measures how efficiently your program converts spending into admitted patients.
What is a good cost per referral benchmark for healthcare facilities?
A CPR below $15 is considered excellent, while $30–$50 is the average range for most referral programs. A CPR above $50 signals that your referral intake process or incentive structure needs review.
How do I calculate referral costs accurately?
Add together all referral incentives, software fees, marketing costs, and staff time spent on referral intake and clinical validation, then divide by the number of successful referrals in the same period.
Why do referred patients have higher value than non-referred patients?
Referred patients generate 15–25% higher lifetime value and show 18% lower churn rates compared to non-referred patients, making referral programs a financially superior acquisition channel despite their upfront costs.
When should a facility accept a higher cost per referral?
A higher CPR is justified when the referred patient population has greater clinical acuity, longer average stays, and higher total revenue per admission. Always evaluate CPR alongside patient lifetime value before cutting referral program spending.