
Admissions SLA metrics are the measurable time and completion targets that govern each step of a patient referral, from the moment it arrives to the day a bed is occupied. Prioritize one KPI first: referral loop closure, tracked alongside referral-to-admit time. Below, we cover the core KPIs, data sources, targets, dashboards, and the improvements worth piloting.
TL;DR:
- Count loop closure only when the consultant report reaches the referring clinician and enters the active record; a completed appointment alone does not qualify.
- Record referral creation, first review, eligibility verification, acceptance, bed occupancy, and report receipt as timestamps, then audit ten referrals before building dashboards.
- Set targets from a full baseline period, compare median times with long delay breaches, and review operational performance weekly and leadership trends monthly.
- A two to four week pilot of one change at a time supports before and after measurement; practitioner examples report 76.8% completion after EMR integration.
Table of Contents
- Why do admissions SLA metrics matter for your facility?
- Which admissions KPIs should you track, and how do you calculate them?
- How do you collect the data reliably?
- How should you set SLA targets and benchmarks?
- What should your admissions dashboards show?
- Which process changes improve your SLA metrics first?
- Why I keep the measurement set small
- How Smart Admissions turns these KPIs into daily numbers
- FAQ
- Sources
Why do admissions SLA metrics matter for your facility?
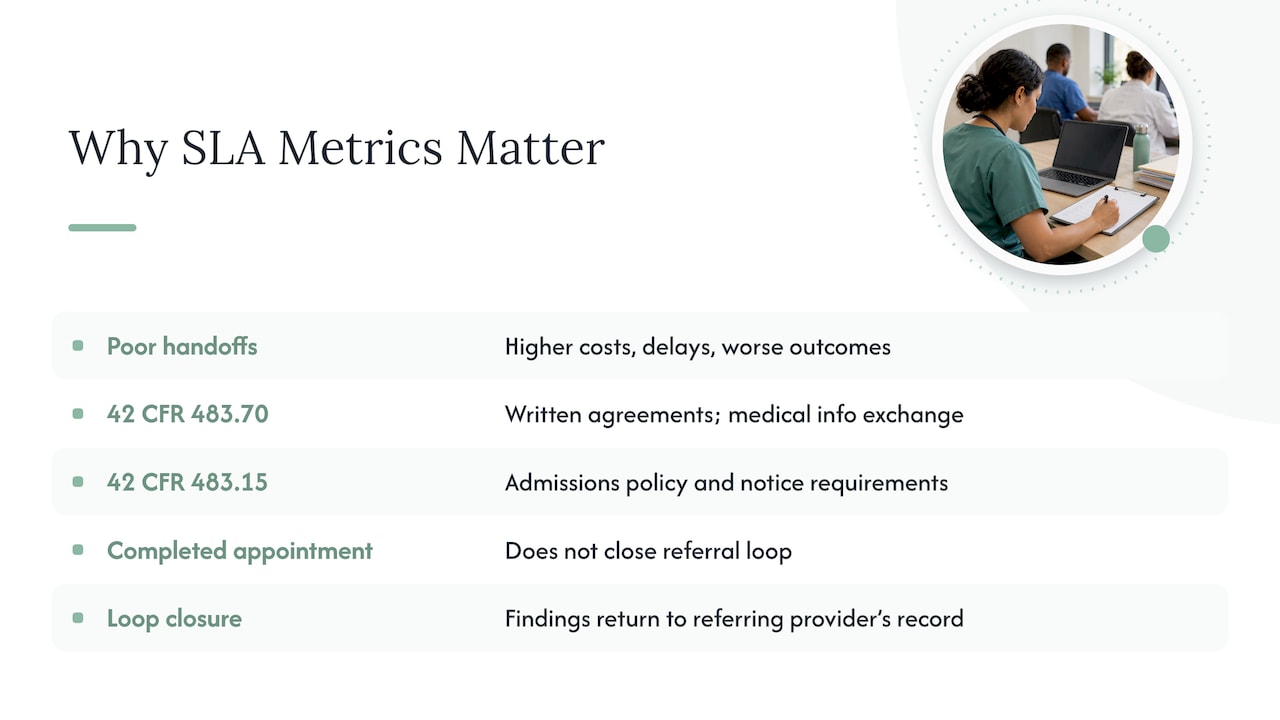
When referral handoffs break down, the costs show up everywhere: IHI and National Patient Safety Foundation guidance notes that poor handoffs raise costs, delay appointments, and worsen patient outcomes. Missed or delayed referrals also contribute to diagnostic delays, a pattern documented in a systems engineering analysis of closed-loop referral processes.
Regulation adds a second reason to measure. 42 CFR 483.70 requires written transfer agreements and the exchange of necessary medical information at transfers, while 42 CFR 483.15 sets admissions policy and notice requirements. You cannot show compliance without timestamps.
One distinction matters from day one. A completed appointment is not a closed loop. As eCQI practitioner guidance explains, loop closure means the specialist’s findings return to the referring provider and enter the active record.
Which admissions KPIs should you track, and how do you calculate them?
Start with a short set and write the calculation rule down before anyone builds a report. For loop closure, borrow the language of the CMS50 measure: the numerator is patients with referrals where the referring clinician received the consultant report, and the denominator is patients with referrals in the measurement period.
- Referral loop-closure rate: referrals with a consultant report received, divided by all referrals in the period. Fields: referral created date, report received date.
- Referral-to-decision and referral-to-admit time: report the median and a measure of the longest delays. Fields: referral received, first review, decision, and admission timestamps.
- Referral completion rate: appointments completed divided by referrals scheduled. Fields: scheduled date, completed flag.
- Eligibility verification time: referral received to payer verification completed. Fields: both event timestamps and the payer name.
- Bed fill time: accepted referral to bed occupied. Fields: acceptance and occupancy timestamps.
- Contact attempt success rate and first-contact resolution: successful contacts divided by attempts, and issues resolved on the first contact. Fields: attempt log with outcome. Our guide to managing admissions calls covers the workflow behind this one.
Medians show typical performance. A measure of the longest delays shows where referrals are getting stuck.
How do you collect the data reliably?
Pull each KPI from the system that already records the event. Referral manager logs and EHR audit trails supply creation, review, and acceptance times. Eligibility systems supply verification times. Admission records supply occupancy and point of origin, and the SNF QRP measure calculations manual shows how CMS selects Medicare Part A stays for reporting. For consistent source coding, the Joint Commission’s Resident of Other Health Care Facility guidance lists suggested data sources, and its Point of Origin release note explains the allowable codes.
Capture these events as timestamps: referral created, first review, eligibility verified, acceptance, bed occupied, and consultant report received.

The usual pitfalls are fax-to-referral gaps where a paper referral is keyed in hours later, missing report-received events, and counting a completed appointment as a closed loop. Electronic tools help: a controlled study of an electronic referral tool found specialists had the needed information before the visit 62% of the time, versus 12% with traditional communication. AHRQ research on a referral manager describes automatic letters and status tracking.
Minimum field checklist: referral ID, source, payer, the six timestamps, decision, and report flag. Our referral audit checklist helps you validate them.
Pro Tip: Audit ten recent referrals end to end before building any dashboard. If you cannot trace all six timestamps for each one, fix the recording gap first.
How should you set SLA targets and benchmarks?
Use three steps: baseline, incremental target, stretch target. Measure current performance for a full period, set a target slightly better than your median, then raise the bar once the process holds. Avoid reading trends from a handful of referrals; wait until each month has enough volume to be meaningful.
External references anchor your definitions. CMS50 sets the measurement-period logic for loop closure, and its earlier 13.2.000 specification shows how the numerator rules stayed consistent. The SNF QRP manual describes reporting cadence and submission deadlines for public reporting.
Illustrative only, not market data: say your baseline median referral-to-decision time is longer than your desired target. Set a reasonable first target below the baseline.
- Median target: governs the typical referral.
- Long-delay threshold: the SLA breach line that triggers escalation.
- Review cadence: weekly for operations, monthly for leadership, so a bad week does not rewrite your targets.
What should your admissions dashboards show?
Build two views. The operations view answers “what needs action right now?” The leadership view answers “are we getting better?”
- Operations: live referral queue, referrals that have exceeded SLA thresholds, eligibility verification backlog, and open action items by owner.
- Leadership: rolling median and long-delay trends, a loop-closure funnel from referral to report received, and top delay drivers.
- Alerts: a referral that remains without eligibility verification beyond your chosen threshold escalates to the admissions director.
Funnel charts suit loop closure, and trend lines suit time-based KPIs. Queue scoring can sharpen the live view, and our guide to admissions queue prioritization explains how. For the data feed, see our walkthrough on integrating EMR with referrals.
Which process changes improve your SLA metrics first?
Pilot in this order, since each step makes the next one measurable:
- Replace fax workarounds with EMR-integrated referral management. Practitioner examples report referral completion rising to 76.8% after this move, along with less time spent chasing documents.
- Automate real-time eligibility verification so payer checks stop blocking acceptance.
- Standardize referral templates and required fields to cut back-and-forth requests.
- Assign one accountable role for loop closure, consistent with the IHI view that responsibility is shared across leaders, vendors, and clinicians.
- Run a two to four week pilot with before-and-after KPI measurement and a fixed daily review window.
Human-factors research supports standardized transition documentation over fragile workarounds. More tactics are in our guide to reducing referral times.
Pro Tip: Change one thing per pilot. If you switch templates and verification at once, you will not know which one moved the numbers.
Why I keep the measurement set small
Most admissions teams do not fail from too little data. They fail from too many metrics nobody acts on. Keep two numbers at the center: loop closure and referral-to-admit time. Put them on the table at the weekly huddle, name an owner for every referral past threshold, and escalate anything that repeatedly breaches the long-delay threshold. Everything else on your dashboard should explain why those two numbers moved.
— Harry
How Smart Admissions turns these KPIs into daily numbers
Our AI-powered referral management assistant integrates with your EMR and insurance portals, so the timestamps in this article are captured as the work happens instead of keyed in afterward. Real-time eligibility verification shortens verification time, and automated intake workflows help move accepted referrals toward occupied beds faster. We built our analytics around the same KPIs: loop closure, verification time, and bed fill time. See what we offer and our pricing, then ask us for a pilot on your own referral queue.
FAQ
What are admissions SLA metrics?
They are time and completion targets for each step of patient referral and intake, such as referral-to-decision time and eligibility verification time. Teams use them to spot delays and hold the process to a consistent standard.
Which admissions KPI should I measure first?
Start with referral loop closure, which asks whether the referring clinician received the consultant report. The CMS50 measure gives you ready-made numerator and denominator language.
How is loop closure different from appointment completion?
Appointment completion means the visit happened. Loop closure means the specialist’s findings came back to the referring provider and entered the record, as the eCQI guidance describes.
Does patient engagement affect referral completion?
It can. A retrospective cohort study found completion was highest among patients who read visit notes on a portal, which suggests patient engagement may be associated with referral completion.
Sources
- Pubmed
- Skilled Nursing Facility Quality Reporting Program Measure Calculations and Reporting User’s Manual