
Bed capacity planning is the discipline of matching the number and type of available beds to expected patient demand, and the fastest way to improve it is to pair data-driven forecasting with operational throughput governance. Instead of guessing at census trends, we use historical admission and discharge patterns, length-of-stay distributions, and real-time data feeds to predict demand and then assign a named owner to act on that forecast daily. Facilities that combine both pieces typically see fewer bottlenecks and steadier occupancy utilization within the first quarter.
TL;DR:
- Combining data-driven forecasting with operational throughput management reduces bottlenecks and steadies occupancy within the first quarter.
- The most critical metrics include turnover and ED boarding time, which reveal capacity issues often hidden behind average occupancy rates.
- Short-term demand forecasts are best served by machine learning models, while simulation tools are more suitable for testing policy changes months in advance.
- Clear ownership, regular meeting routines, and threshold-based triggers are essential to turn forecasts into effective operational actions.
- Prioritizing data quality and starting with a single unit for discharge acceleration and daily huddles provides a low-risk approach to improving bed capacity planning.
Table of Contents
- Why bed capacity planning matters and the core metrics you must track
- Forecasting approaches: matching the model to the planning horizon
- Operational tactics that improve throughput and reduce capacity pressure
- Putting forecasting into practice: governance, KPIs, and decision cadence
- Tools and technology categories: evaluating software for capacity planning
- Evidence and case examples: what the research actually supports
- Your 30 to 90 day starter checklist
- What experience teaches about bed capacity planning
- How Smart Admissions supports this plan
- FAQ
- Sources
Why bed capacity planning matters and the core metrics you must track
When bed capacity planning fails, the consequences show up fast: patients wait in hallways, emergency department boarding climbs, nurses absorb unsafe patient loads, and elective cases get canceled to free up space. Those are not abstract risks. They show up in staff turnover, in patient safety incidents, and in lost revenue from diverted admissions.
Getting ahead of it starts with tracking the right metrics, not just watching the census number on a whiteboard.
- Occupancy rate: the share of staffed beds in use at a given time, the headline number but the least useful on its own.
- Length of stay (LOS): how many days a patient occupies a bed, broken out by unit and diagnosis rather than averaged across the whole hospital.
- Turnover: how many patients cycle through a bed in a given period, a direct measure of throughput efficiency.
- Throughput: the end-to-end speed of movement from admission to discharge across every step in between.
- ED boarding time: how long admitted patients wait in the emergency department for an inpatient bed, often the clearest symptom of a capacity problem upstream.
These metrics interact. Modeling LOS variability for capacity planning found that relying on static averages instead of empirical LOS distributions tends to understate peak demand, which leads directly to under-staffing and poor bed allocation on the days that matter most.
A facility can run healthy average occupancy and still board patients in the ED for hours if LOS variance on even one unit spikes unpredictably. That gap between average and peak is where most bed capacity planning efforts fall short.
Forecasting approaches: matching the model to the planning horizon
Not every forecasting problem needs the same tool, and picking the wrong one wastes months. Four method families cover most bed capacity planning needs, each suited to a different planning horizon and a different kind of question.
Stochastic simulation models arrival and discharge events as random variables drawn from historical distributions, useful for strategic questions like how many beds a new wing needs. Discrete-event simulation (DES) goes further by modeling the sequence of events a patient moves through (admission, transfer, discharge) and is strong for testing “what-if” operational policies before you roll them out. Queuing models borrow from operations research to estimate wait times and blocking probabilities, well suited to tactical questions about a specific unit or service line. Machine learning and time-series forecasting predicts short-term demand using patterns in recent data, including LOS itself as a predicted variable, and fits best for operational, day-to-day and week-to-week decisions.
| Method | Best planning horizon | Core requirement | Typical use case |
|---|---|---|---|
| Stochastic simulation | Strategic (months to years) | Historical arrival and LOS distributions | Sizing a new unit or wing |
| Discrete-event simulation | Tactical (weeks to months) | Mapped patient flow sequence | Testing a new discharge policy |
| Queuing models | Tactical (weeks) | Arrival rate and service time data | Estimating ED boarding risk |
| ML and time-series forecasting | Operational (days to weeks) | Clean historical data, seasonality, event covariates | Predicting next week’s census |
Each approach needs the same raw material in different forms: empirical LOS distributions rather than single averages, seasonality (day-of-week, holiday, and seasonal illness patterns), and event covariates like local outbreaks or scheduled surgical surges. A model that ignores seasonality will look accurate most weeks and fail exactly when you need it most.
The accuracy gains from combining these approaches can be substantial. Research combining machine learning and optimization for the patient-bed assignment problem found that ML-based forecasting improved emergency arrival predictions by up to 17% in RMSE compared with historical-average baselines, and pairing that forecast with optimization produced measurable gains in bed assignment performance in a real hospital case study. A related pipeline study on forecasting surgical bed utilization that modeled LOS and surgical volume together reported forecast error dropping from roughly 43 beds RMSE to roughly 24 beds for multi-week forecasts, a meaningful improvement for units planning staffing several weeks out.
Simulation earns its place where you need to test a policy before committing to it: What happens if we add four swing beds? What happens if discharge rounds move an hour earlier? ML forecasting earns its place where you need the sharpest near-term number for tomorrow’s staffing plan. Most mature programs end up running both, with simulation informing structural decisions and ML/time-series models driving the daily operating rhythm. A recent review of patient flow logistics across strategic, tactical, and operational horizons reaches a similar conclusion: no single method family covers every planning question, and the strongest programs blend them deliberately rather than picking one and forcing every decision through it.
Operational tactics that improve throughput and reduce capacity pressure
Forecasting tells you what is coming. Throughput tactics are what you do about it, and several of them pay off within weeks rather than months.
- Name a flow manager. Patient flow management is a distinct discipline from simply watching patient flow metrics, and it requires a dedicated person with authority to coordinate across units, not just a report that circulates by e-mail. A concept analysis of patient flow management found that a named flow manager paired with dynamic data integration, rather than technology alone, is what drives sustained improvement in bottleneck reduction and care quality.
- Accelerate discharge timing. Move physician rounds earlier, set a target discharge order time before noon, and pre-identify “likely discharge tomorrow” patients the evening before so morning logistics do not stall on paperwork.
- Activate full-capacity protocols early, not as a last resort. Define in advance which overflow beds, hallway placements, or alternate units come online at specific occupancy thresholds, so staff are not improvising during a surge.
- Coordinate elective surgery scheduling with projected census. Smooth the OR schedule across the week rather than clustering high-LOS procedures on the same days, which otherwise collides with weekend discharge slowdowns.
- Align staffing to forecasted demand, not last year’s template. Use your forecast to flex staffing up or down by unit rather than applying a flat schedule regardless of predicted volume.
Pro Tip: Start discharge acceleration with just one unit for 30 days before rolling it facility-wide. A focused pilot surfaces friction points (pharmacy delays, transport scheduling) that a full rollout would otherwise hide until it is too late to fix cheaply.
Practical guidance on occupancy optimization strategies covers additional discharge and placement tactics that complement the steps above.
Putting forecasting into practice: governance, KPIs, and decision cadence
A forecast that nobody acts on is just a spreadsheet. Turning it into operational change requires clear ownership, a regular meeting cadence, and thresholds that trigger specific actions automatically.
Assign forecast ownership to a specific role, often the flow manager or a bed management coordinator, with explicit authority to request overflow protocols or escalate staffing requests. Build a cadence around three loops:
- Daily huddles: a short, standing meeting reviewing today’s census, expected discharges, and any units approaching capacity thresholds.
- Weekly reviews: comparing forecasted versus actual occupancy to catch model drift before it compounds.
- Monthly planning sessions: reviewing elective surgery schedules, seasonal trends, and staffing plans against the rolling forecast.
Set KPI trigger thresholds in advance rather than deciding in the moment.
Change management matters as much as the technical setup. Staff who have watched capacity initiatives come and go are reasonably skeptical of another dashboard. Involve charge nurses and discharge planners in defining the thresholds themselves, so the triggers reflect operational reality rather than a model built in isolation. Our guide to admission capacity planning walks through how facilities structure this kind of rollout over a 90-day window.
Tools and technology categories: evaluating software for capacity planning
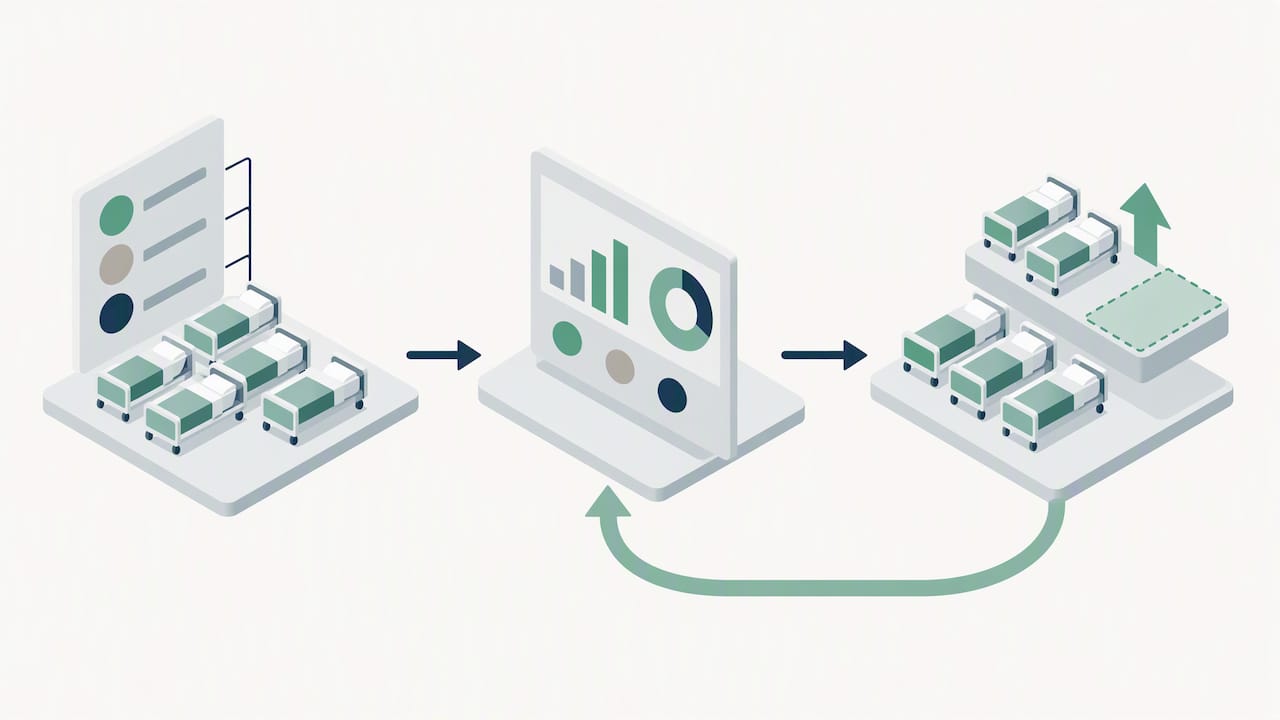
Software for bed capacity planning generally falls into four categories, and knowing which problem each one solves prevents buying the wrong tool for the job.
- Forecast engines: statistical and ML models that predict census, arrivals, and LOS from historical data.
- Simulation platforms: discrete-event and stochastic simulation tools for testing policy changes before implementation.
- EMR connectors and integration layers: the plumbing that gets ADT, census, and scheduling data out of your EHR and into a usable format.
- Intake and referral automation: tools that speed the front end of the pipeline, how quickly a referral becomes an occupied bed.
When evaluating any of these, run through a short checklist: Does it connect directly to your existing data feeds, or does it require manual exports? Does it update in real time, or only on a batch schedule? Can you understand why the model produced a given forecast, or is it a black box? Is it usable by admissions and nursing staff without extensive training? And does it meet the compliance standards your facility is bound to, including HIPAA and the data-handling expectations referenced in government oversight guidance from the Office of Inspector General?
| Category | Primary job | What to check before buying |
|---|---|---|
| Forecast engines | Predict census, arrivals, LOS | Data freshness, explainability |
| Simulation platforms | Test policy changes safely | Flexibility to model your actual unit layout |
| EMR connectors | Move data out of the EHR reliably | Real-time vs. batch updates |
| Intake automation | Speed referral-to-bed time | EMR and insurance portal integration |
We built Smart Admissions to cover that last category directly: automating referral review, verifying insurance eligibility in real time, and integrating with existing EMR and insurance portals so the admissions side of your pipeline stops being the bottleneck that undermines an otherwise solid forecast. A facility can have a near-perfect census forecast and still lose beds to slow referral paperwork, which is the gap we focus on closing.
Evidence and case examples: what the research actually supports
The peer-reviewed literature on bed capacity forecasting is still young, but a few findings are consistent enough to act on. ML forecasting paired with optimization has shown measurable improvements over historical-average baselines in multiple studies, and simulation remains the tool of choice for testing policy changes before committing resources to them.
- Machine learning forecasting improved emergency arrival prediction accuracy significantly in RMSE compared with historical averages in a real hospital case study, with corresponding gains in bed assignment optimization.
- Government guidance from the CDC’s NHSN Hospital Bed Capacity Project offers standardized data definitions hospitals can use for planning outside surge situations, which matters because inconsistent definitions across units are a common source of forecasting error.
- The AHRQ Quality Indicators Toolkit provides ready-to-use project charters, gap analyses, and monitoring templates that shorten the setup time for a capacity improvement project considerably.
**Studies combining LOS prediction with surgical volume forecasting have substantially reduced multi-week forecast error, according to research on surgical bed utilization. This is a meaningful gain for units planning staffing weeks ahead.
The common caveat across this research is data quality. Every model performs worse on facilities with inconsistent timestamp practices or missing discharge fields, and model drift sets in whenever referral patterns, payer mix, or local population health shifts without a corresponding model refresh.
Your 30 to 90 day starter checklist
- Week 1: Pull ADT, census, OR schedule, and ED arrival data; run the quality checks described above and fix timestamp gaps.
- Weeks 2 to 4: Launch daily discharge huddles on one pilot unit and name a flow manager for that unit.
- Weeks 4 to 8: Build a basic time-series forecast using your cleaned historical data, starting with next-week census predictions.
- Weeks 8 to 12: Pilot the forecast alongside your discharge huddles, track forecast error weekly, and expand to a second unit once the first shows stable results.
What experience teaches about bed capacity planning
The biggest pitfall we see is facilities buying a forecasting tool before fixing their data. A sophisticated model built on inconsistent timestamps produces confident, wrong answers, which is worse than no model at all. The second pitfall is skipping the flow manager role and expecting a dashboard to change behavior on its own. The third is chasing average occupancy instead of LOS variance, which hides exactly the peaks that cause gridlock.
Leadership has to accept a real trade-off: short-term staffing flexibility for long-term forecast accuracy, since rigid templated schedules are easier to plan but blind to actual demand. If we could recommend only one experiment to start with, it would be this: pick a single unit, clean its data, and run daily discharge huddles for 30 days before touching any forecasting software at all.
— Harry
How Smart Admissions supports this plan
Everything above depends on one thing moving fast enough to matter: getting the right patient into the right bed before the opportunity closes. That is the specific gap we built Smart Admissions to close.
Our AI-powered referral management platform automates the repetitive parts of intake, real-time eligibility verification, clinical assessment review, documentation handling, so your admissions team can act on a capacity forecast the moment a bed opens rather than days later.
- Faster referral review means your forecast-driven overflow and discharge plans actually get filled on schedule.
- Real-time EMR and insurance portal integration removes the manual lookups that usually stall admissions decisions.
- Analytics and reporting give administrators visibility into fill rates alongside the occupancy metrics covered in this guide.
Onboarding is designed to be quick, and we offer a guarantee intended to demonstrate the platform’s value promptly. If you are ready to see how it fits your admissions workflow, visit our pricing page to compare the Monthly plan at $597 per month or the Annually plan at $6,447 per year, or reach out for a demo.
FAQ
What are the three types of capacity planning?
Capacity planning is generally grouped into strategic, tactical, and operational horizons, covering long-term structural decisions, medium-term scheduling and policy adjustments, and short-term daily staffing and bed assignment respectively. A review of patient flow logistics categorizes capacity problems across exactly these three horizons and recommends matching the forecasting or simulation method to each one.
How many hospital beds are needed per 1,000 people?
Bed-to-population ratios vary significantly by country, region, and healthcare system structure, and no single figure applies universally. Rather than relying on a population ratio, facility-level planning works better when grounded in local demand data, including the occupancy, LOS, and throughput metrics described in this guide.
What is the maximum weight a hospital bed can hold?
Weight capacity depends entirely on the specific bed model and manufacturer, with standard hospital beds and specialized bariatric beds rated very differently. Facilities should check the manufacturer’s specification sheet for each bed model rather than assume a single universal limit.
What is the 3-day rule in hospitals?
The “3-day rule” most commonly refers to a Medicare requirement around prior inpatient hospital stays affecting skilled nursing facility coverage eligibility, though specific rules and exceptions vary by payer and program. Facilities handling swing-bed or post-acute placements should verify current eligibility requirements directly rather than relying on a general rule of thumb; our guide to swing bed admissions covers related placement timing considerations.
Sources
A forecasting model is only as good as the data behind it, and most facilities already have everything they need scattered across systems that rarely talk to each other. Before building any model, pull together these core feeds:
- An analysis of the concept of patient flow management
- Toolkit for Using the AHRQ Quality Indicators
- Hospital Bed Capacity Project | NHSN
- Combining machine learning and optimization for the operational patient-bed assignment problem
Once you have the feeds, the fields matter as much as the sources. You need admit and discharge timestamps down to the hour (not just the date), bed type and unit assignment, and an “expected discharge date” field that clinicians actually update, not one that defaults to a placeholder value and never changes.
Run a few quick quality checks before trusting any of it. Look for duplicate ADT events, negative or zero LOS values (a common sign of timestamp errors), and beds marked occupied with no matching admission record. Missing or censored LOS data, where a patient is still admitted when your data pull happens, needs to be handled explicitly in your model rather than dropped, or your forecasts will systematically underestimate how long current patients will stay.
Pro Tip: Run your data-quality checks weekly, not once at project kickoff. ADT feeds drift as EHR configurations change, and a clean dataset in January can develop silent gaps by March.
For a deeper look at how daily bed operations connect to these inputs, our guide on bed management practices walks through the operational side in more detail.