
TL;DR:
- Optimizing existing bed management processes can generate significant occupancy improvements without expanding facilities.
- Implementing technology-driven workflows, strengthening referral relationships, and streamlining discharge planning are key strategies to boost census and revenue.
Most skilled nursing facilities and rehabilitation centers facing low census numbers immediately assume the answer is more beds. That instinct is understandable but often wrong. Technology implementation in healthcare settings improved bed occupancy from 75% to 80%, increased bed turnover by 11%, and boosted monthly admissions by 12%, all without adding a single new bed. The real opportunity in 2026 is not building out; it is optimizing what your facility already has. This guide walks your admissions team through the frameworks, metrics, and tactics that drive measurable, lasting gains in bed occupancy.
Table of Contents
- Why bed occupancy optimization is critical
- Understanding occupancy metrics and industry benchmarks
- Proven strategies for boosting bed occupancy
- Avoiding common pitfalls and finding hidden capacity
- The real secret: Optimize before you expand
- Take your admissions and occupancy to the next level
- Frequently asked questions
Key Takeaways
| Point | Details |
|---|---|
| Occupancy optimization outperforms expansion | Optimizing your current beds and workflows can add capacity faster than building new beds. |
| Benchmarks matter | Aim for 80-85 percent occupancy and avoid going over 90 percent to prevent bottlenecks. |
| Tech and process drive results | Adopting technology and Lean methods can improve occupancy, reduce wait times, and boost admissions. |
| Avoid common traps | Overfilling beyond benchmarks leads to longer waits and patient diversions. |
| Referral strategies are key | Enhanced referral and network management significantly increases occupancy and shortens length of stay. |
Why bed occupancy optimization is critical
Bed occupancy is more than a census number on a morning report. It is a direct indicator of your facility’s financial health, care quality, and operational efficiency. When beds sit empty, revenue is lost. When beds are overfilled, care quality suffers and your team burns out. Striking the right balance is one of the most important operational challenges your admissions leadership team faces today.
Understanding bed management for efficiency means recognizing that every empty bed represents unrecovered cost. Fixed expenses like staffing, utilities, and overhead do not decrease when census drops. Your revenue, however, drops sharply. Conversely, when your facility operates too close to full capacity, discharge planning becomes rushed, staff become stretched, and improved outcomes in assisted living become harder to deliver consistently.
Here is what optimized bed occupancy delivers for your facility:
- Stable, predictable revenue that allows for better financial planning and staffing decisions
- Improved care quality through appropriate staff-to-patient ratios and manageable workloads
- Faster referral-to-admission cycles that strengthen relationships with referring hospitals and discharge planners
- Reduced administrative burden when intake workflows are efficient and well-organized
- Competitive advantage in markets where hospital discharge planners select SNF partners based on responsiveness and reliability
“Lean-AI integration yields 30+ equivalent bed gains without facility expansion. Industry benchmarks target 80-85% occupancy, and levels over 90% lead to wait times and patient diversions.”
The referral-to-bed process is one of the most underexamined areas in skilled nursing operations. Tightening this process alone can produce occupancy improvements that rival what most facilities expect from capital-intensive bed additions. The data is clear: optimizing what you have generates results faster and at a fraction of the cost.
Understanding occupancy metrics and industry benchmarks
Once you recognize the stakes, it becomes crucial to understand how occupancy is measured and what standards you should strive for. Without precise metrics, your team is essentially managing census by intuition rather than evidence.
Three core terms define occupancy performance:
Bed occupancy rate (BOR): The percentage of available beds filled at a given time, typically measured daily, weekly, or monthly. It is calculated as occupied beds divided by total available beds, multiplied by 100.
Bed turnover rate: The number of patients discharged per available bed over a defined period. A higher turnover rate indicates that your facility is processing admissions and discharges efficiently, without beds sitting idle between patients.
Length of stay (LOS): The average number of days a patient occupies a bed. Managing LOS is essential because unnecessarily long stays reduce the number of patients your facility can serve and limit revenue from new admissions.
Here is how those metrics benchmark against current industry data:
| Metric | Current Baseline | With Technology | Industry Target |
|---|---|---|---|
| Bed occupancy rate | 75% | 80% | 80-85% |
| Bed turnover improvement | Baseline | +11% | Consistent gains |
| Monthly admissions growth | Baseline | +12% | Ongoing improvement |
| Occupancy risk threshold | Below 80% | Above 90% | Avoid exceeding |
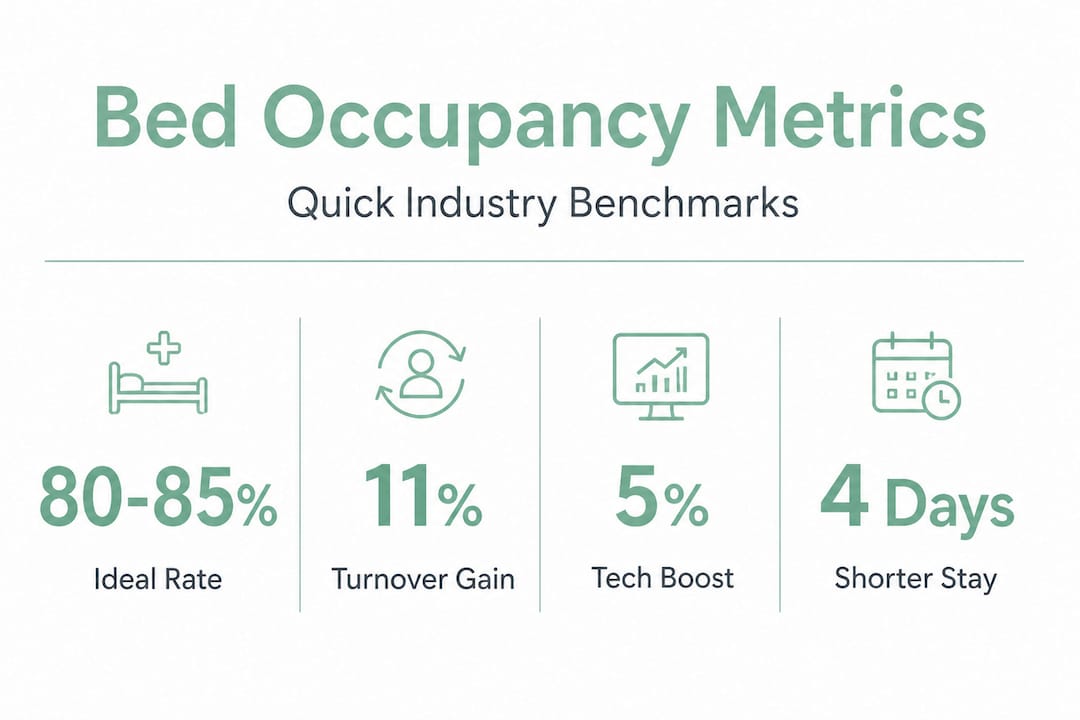
The 80-85% range is not arbitrary. It represents the operational sweet spot where your facility generates strong revenue, maintains care quality, and retains the flexibility to accept urgent or complex admissions. Facilities that push past 90% occupancy regularly find themselves diverting referrals, extending LOS due to discharge coordination delays, and experiencing elevated staff turnover from workload pressure.
Pro Tip: Track your BOR alongside your bed turnover rate every week, not just monthly. A high BOR combined with a dropping turnover rate often signals hidden discharge bottlenecks that are silently capping your admissions pipeline.
Reviewing bed management best practices for your specific facility type, whether short-term rehabilitation or long-term skilled nursing, is essential because the metrics that matter most will differ by payer mix, acuity level, and patient population.
Proven strategies for boosting bed occupancy
With foundational metrics established, let’s put them to work with actionable tactics proven to improve occupancy. These strategies span both process redesign and technology adoption, and your team can begin implementing several of them immediately.
1. Join and actively leverage SNF network partnerships
SNF network participation reduced length of stay by 4 days. When combined with transitional care management programs, the reduction extended to 5 days, saving between $2,224 and $2,780 per admission. That is not a marginal gain. For a facility admitting 20 patients per month, that represents tens of thousands of dollars in cost efficiency and a significantly faster bed turnover cycle.
Joining an SNF network means establishing preferred-provider relationships with hospital systems, creating standardized communication protocols for discharge planning, and positioning your facility as the reliable, first-call option for case managers.
2. Implement just-in-time bed assignment
Traditional bed assignment processes often involve manual coordination, delayed housekeeping notifications, and reactive communication between nursing, admissions, and environmental services. Just-in-time bed assignment reduced patient wait times by 25% overall, with even stronger results for specific transfer types: 33% reduction for ED-to-floor transfers and 37% for PACU-to-floor transfers.
For your SNF or rehab center, this means assigning beds at the moment of confirmed admission rather than waiting until the patient arrives. It requires real-time bed status visibility and clear workflows across all departments involved in the admission process.
3. Automate referral tracking and intake workflows
Referral delays are one of the most common and most fixable causes of lost admissions. When a hospital discharge planner sends a referral and waits hours or days for a response, they move on to the next facility. Your team may never know the opportunity was missed.
Reviewing referral-to-bed occupancy improvements shows that facilities reducing referral response time consistently see 12% or higher gains in monthly admissions. Automating the intake workflow means referrals are triaged, reviewed, and accepted or declined faster, with less manual effort from your admissions staff.

4. Strengthen transitional care management
Post-discharge support from transitional care post-discharge programs reduces readmissions and supports smoother care transitions. For your facility, this matters because preventing unnecessary readmissions protects your quality scores, which in turn influence how often hospital case managers refer patients to you.
5. Optimize referral source relationships and strategies
Your admissions team should regularly analyze which referral sources produce the highest volume, fastest authorizations, and most appropriate patient acuity. Applying focused referral strategies to boost fill rates based on this data ensures your outreach effort is directed where it produces the greatest occupancy impact.
Here is a comparison of process-driven versus technology-driven approaches to occupancy improvement:
| Approach | Implementation Time | Cost | Occupancy Impact | Best For |
|---|---|---|---|---|
| SNF network participation | 1-3 months | Low to moderate | High (4-5 day LOS reduction) | Facilities near hospital systems |
| Just-in-time bed assignment | 2-6 weeks | Low | Moderate to high | Any facility size |
| Referral workflow automation | 2-4 weeks | Moderate | High (12% admissions gain) | Facilities with high referral volume |
| Transitional care management | 3-6 months | Moderate | Moderate | Long-term census stability |
| Lean process redesign | 3-12 months | Moderate to high | Very high (30+ bed equivalent) | Large facilities with complex workflows |
Pro Tip: Start with referral workflow automation and just-in-time bed assignment. Both produce measurable results within 30 to 60 days and require far less organizational change than Lean redesign or SNF network development. Use early wins to build internal momentum for larger process improvements.
For teams ready to examine the intake process more closely, referral tracking upgrades are often the fastest lever available to admissions leaders looking for immediate census improvement.
Avoiding common pitfalls and finding hidden capacity
After exploring what works, it is equally important to recognize what to avoid and how to unearth untapped capacity in your facility.
The most common pitfall admissions leaders fall into is treating high occupancy as automatically positive. Pushing census above 90% feels like a success on paper, but the operational consequences are significant:
- Extended discharge delays as care coordinators struggle to manage high patient volume
- Increased patient wait times in emergency settings when transfers cannot be accepted promptly
- Staff burnout and turnover driven by unsustainable workloads, which ultimately forces census reductions anyway
- Diversion of referrals when your facility cannot accept urgent or high-acuity patients, damaging referral source relationships
- Regulatory risk when documentation, care planning, and compliance tasks fall behind due to staff overload
“Lean-AI integration yields 30 or more equivalent bed gains without expansion. Occupancy levels over 90% lead to wait times and diversions that undermine care quality and financial performance.”
Hidden capacity is often found in three places most facilities overlook. First, discharge planning inefficiencies that keep patients in beds longer than clinically necessary. Second, referral response delays that allow beds to sit empty for hours or days between admissions. Third, under-optimized room configurations, where wing or unit assignments are not matched to current payer mix or acuity demand.
When your team takes the time to analyze your referral data, patterns often emerge that reveal exactly where beds are being lost. You may find that a specific referral source consistently sends patients with complex authorization requirements that slow intake, or that a particular unit consistently has longer discharge-to-clean-bed turnaround times.
Another factor worth monitoring is the impact of nonprofit ownership models in local markets. Some nonprofit-driven operational models, while well-intentioned, can unintentionally create barriers to Medicaid access, reducing the effective patient population for facilities that rely on diverse payer mixes. Staying aware of trends in senior living in your market helps your admissions team anticipate shifts in referral patterns before they affect census.
The real secret: Optimize before you expand
Here is the perspective that most consultants and industry publications still undervalue: the default response to low census or growing demand should never be capital expenditure for additional beds.
Facility expansion takes 12 to 36 months, requires significant capital investment, brings regulatory complexity, and often does not address the root cause of underperformance. If your admissions process is slow, your referral response time is poor, or your discharge planning is inefficient, adding 20 more beds will not solve those problems. It will scale them.
The facilities that consistently outperform their peers in census and revenue are not necessarily the ones with the most beds. They are the ones that have built tight, well-measured, continuously improved intake and discharge workflows. They respond to referrals within the hour. Their bed turnaround time is predictable. Their case managers know who to call and when. Their data tells them which referral sources to prioritize each week.
Bed management insights consistently show that facilities applying structured bed management practices outperform those relying on experience and intuition alone, often by significant margins in both occupancy rate and revenue per bed.
The practical implication for your leadership team is this: before any conversation about expansion begins, conduct a rigorous review of your current referral chain, discharge workflow, bed assignment process, and occupancy metrics. In most cases, your facility has capacity it is not currently using effectively. Finding and activating that capacity is faster, cheaper, and more reliable than building new beds.
This is not a theoretical argument. The data from technology-enabled facilities, Lean-redesigned workflows, and SNF network participants all point in the same direction: the biggest gains come from working smarter with what you already have.
Take your admissions and occupancy to the next level
Armed with frameworks and clear benchmarks, admissions decision-makers often ask: what is the practical next step for turning these strategies into real census gains?
Smart Admissions is built specifically for skilled nursing homes and rehabilitation centers ready to move from reactive census management to proactive, data-driven occupancy optimization. The platform automates referral intake, reduces response times, and integrates with your existing EMR and insurance portals for real-time eligibility verification. If you want to understand what is referral management and how modern platforms handle it, the resources on our site walk you through the full picture. You can also explore referral management system examples to see how facilities like yours have improved their processes, or go straight to the guide on how to automate admissions for faster occupancy to see specific workflow improvements that deliver measurable results within weeks, not months.
Frequently asked questions
What is the ideal bed occupancy rate for skilled nursing facilities?
An optimal bed occupancy rate is typically 80-85% for skilled nursing facilities, balancing revenue generation with care quality without triggering wait times or patient diversions.
How does technology improve bed occupancy?
Technology-enabled admissions platforms can boost occupancy by 5%, increase bed turnover by 11%, and grow monthly admissions by 12% by streamlining referral intake and reducing manual processing delays.
What are the risks of exceeding 90% bed occupancy?
Exceeding 90% occupancy typically causes patient wait times, forces diversion of new referrals to competing facilities, and increases staff workload to levels that accelerate burnout and turnover.
What is “just-in-time” bed assignment and its benefit?
Just-in-time bed assignment is a process where beds are assigned at the moment of confirmed admission rather than upon patient arrival, reducing overall wait times by 25% on average and improving transfer efficiency significantly.
Can improving referrals help with bed occupancy optimization?
Yes. SNF network participation combined with transitional care management reduces length of stay by 4 to 5 days per admission, freeing beds faster and enabling your facility to accept a higher volume of referrals each month.