
Occupancy forecasting predicts how many people, or occupied voxels and agents, will fill a space at a future point in time, distinct from occupancy prediction, which reconstructs what’s happening right now. The strongest results come from matching model families to horizon length: time-series baselines and classical machine learning handle steady, longer horizons well, while transformer architectures like OPTnet and occupancy-flow-aware models dominate short, high-frequency, multi-sensor scenarios.
TL;DR:
- Transformer-based models like OPTnet outperform traditional methods in short-term occupancy forecasting across multi-zone buildings, reducing error rates at 1 to 30 minutes ahead.
- Fusing complementary signals such as building telemetry and vision sensors significantly improves forecast accuracy compared to relying on a single sensor type.
- Cross-site generalization remains a challenge, with federated and transfer learning providing better robustness than simple models, especially in healthcare and building environments.
- Starting with simple heuristics and gradually escalating to complex models ensures better trust and prevents overfitting when initial data volume is low.
- In occupancy forecasting for healthcare, referral data and clinical pipeline timing directly influence bed occupancy predictions more than physical sensor signals.
Table of Contents
- What Is Occupancy Forecasting, and How Does It Differ From Prediction?
- What Modeling Approaches Work Best for Occupancy Forecasting?
- Which Data Inputs and Sensors Improve Forecasting Accuracy?
- How Do You Evaluate and Benchmark Occupancy Forecasting Models?
- How Do Buildings and Autonomous Vehicles Differ in Occupancy Forecasting?
- What Deployment Challenges Should You Plan For?
- How Do You Pilot and Scale an Occupancy Forecasting System?
- What Do I Actually Recommend After Reviewing This Research?
- How Smartadmissions Turns Occupancy Forecasting Into Higher Bed Fill
- Sources
What Is Occupancy Forecasting, and How Does It Differ From Prediction?
Occupancy forecasting answers “what will occupancy look like in 10 minutes, 2 hours, or next Tuesday?” Occupancy prediction, by contrast, answers “what is occupancy right now, given noisy or partial sensor data?” The two get used interchangeably in casual conversation, but they solve different operational problems and often require different models entirely.
A skilled nursing facility forecasting bed demand for next week needs a different tool than an autonomous vehicle predicting whether a voxel 200 milliseconds ahead is occupied by a pedestrian. Both fall under the umbrella of occupancy modeling, but the horizon, the data density, and the acceptable error margin diverge sharply.
Typical use cases break down by horizon:
- Sub-second to a few seconds: autonomous vehicle motion planning, where occupancy flow fields track per-voxel movement to avoid collisions.
- Minutes to hours: HVAC control in office buildings, where zone-scale occupancy estimation drives real-time damper and setpoint adjustments.
- Hours to days: hospitality demand forecasting for staffing and dynamic pricing.
- Days to weeks: healthcare bed occupancy planning, where referral pipelines and discharge timing set the horizon.
Accuracy expectations shift accordingly. A 10-minute-ahead building forecast can realistically hit high agreement with sensor ground truth, while a week-out hospitality forecast tolerates wider error bands because staffing and pricing decisions adjust incrementally anyway.
What Modeling Approaches Work Best for Occupancy Forecasting?
Model selection depends on three variables: how far ahead you need to see, how many sensor streams you have, and how much clean historical data already exists. Here’s how the main families stack up.
- Moving averages and ARIMA. These classical time-series baselines work well for single-zone, low-volatility environments with strong daily or weekly seasonality, such as a hotel’s front-desk arrivals pattern. They’re cheap to run and easy to explain to non-technical stakeholders, which matters when you’re pitching a pilot to facility leadership.
- Classical machine learning (decision trees, gradient boosting). Feature-driven approaches shine when you have structured inputs like booking calendars, day-of-week flags, and weather data, but lack the volume for deep learning. They’re a reasonable middle step once averages plateau.
- Sequence models (LSTM, temporal CNNs). These capture longer dependencies across time steps better than classical ML, useful for multi-day occupancy patterns in buildings where yesterday’s anomaly still echoes today.
- Transformer-based multi-sensor models. Architectures modeled on OPTnet fuse inputs from multiple zones and sensor types simultaneously. In a controlled two-week, multi-zone office building experiment, an OPTnet-style transformer outperformed LSTM, decision tree, and MLP baselines across short forecasting horizons, with lower error rates at every interval tested from 1 to 30 minutes ahead. That’s a meaningful signal for anyone forecasting across more than a handful of zones.
- Occupancy grids and occupancy flow fields. For autonomous vehicle applications, static occupancy grids only tell you what’s occupied now. Occupancy flow fields add a per-voxel motion vector to every occupied cell, which helps the model track where an agent is headed instead of just where it currently sits. This joint representation improves motion consistency and agent identity recovery in dense, fast-moving traffic scenes.
Pro Tip: *Don’t jump straight to a transformer because it tops the leaderboard.
Which Data Inputs and Sensors Improve Forecasting Accuracy?
Forecast quality is bounded by input quality, and the biggest gains usually come from fusing complementary signal types rather than adding more of the same sensor.
- Direct occupancy signals: PIR motion sensors, badge-in/badge-out logs, booking calendars, and reservation systems give the most literal read on presence but often lag reality by minutes.
- Building operational signals: HVAC telemetry, CO2 concentration, and power draw act as indirect occupancy proxies and catch presence that direct sensors miss, especially in open-plan spaces.
- Vision and LiDAR: for autonomous vehicle occupancy grids, camera and LiDAR fusion builds the 3D voxel map that per-voxel flow models operate on.
- Healthcare referral and admissions data: incoming referral volume, insurance verification turnaround, and discharge scheduling function as leading indicators for bed occupancy days ahead of a physical bed count.
Zone-scale presence estimation, rather than individual tracking, tends to be the most actionable resolution for HVAC optimization, since finer-grained tracking raises privacy exposure without proportionally improving control decisions. When a sensor stream drops out, forward-filling short gaps and flagging longer outages for exclusion beats naive zero-imputation, which quietly teaches the model that a room went empty when it simply lost signal.
How Do You Evaluate and Benchmark Occupancy Forecasting Models?
Evaluation needs to match the domain, because a metric that makes sense for a driving scene rarely translates cleanly to a building floor plan.
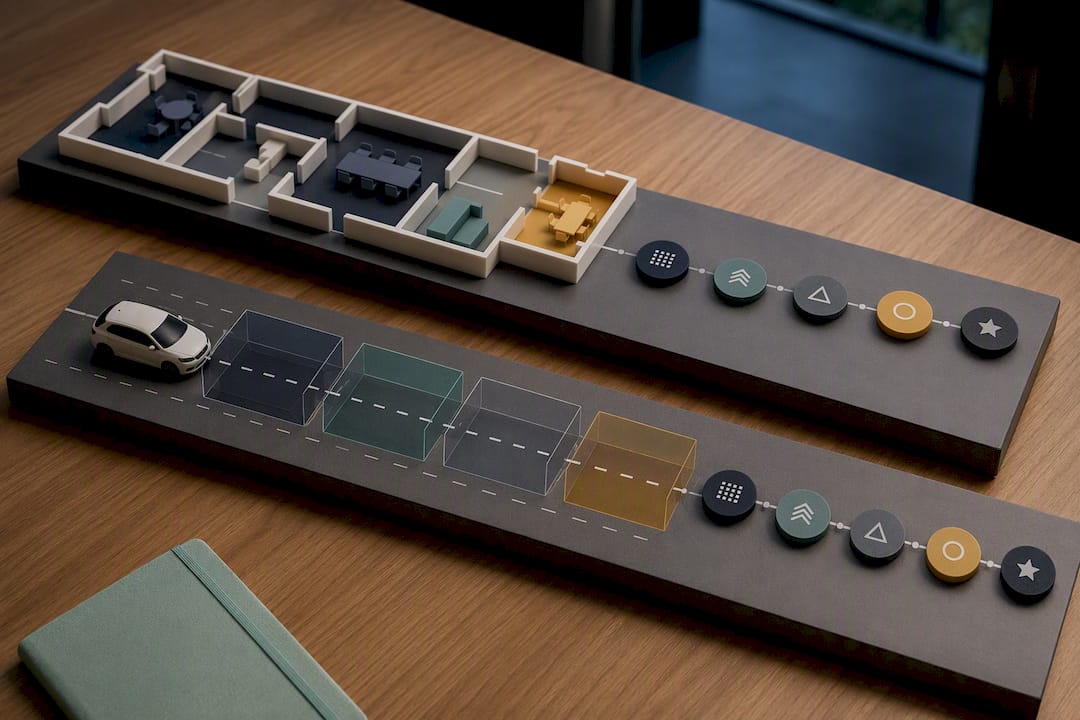
UniOcc has become a reference point for cross-dataset evaluation in autonomous driving. It unifies data from nuScenes and Waymo, adds per-voxel flow annotations on top of standard occupancy labels, and provides benchmark code so researchers can test one model across multiple driving datasets without rebuilding pipelines each time. Argoverse contributes additional 4D spatiotemporal occupancy resources used for the same kind of cross-dataset validation.
Common evaluation metrics include:
- Accuracy and mean squared error (MSE) for straightforward presence and count forecasts.
- Intersection over Union (IoU) and mean IoU (mIoU) for voxel-grid occupancy overlap between predicted and ground-truth maps.
- Flow-consistency metrics, which check whether predicted motion vectors match actual agent trajectories over consecutive frames.
One clear pattern across the research: adding flow information doesn’t just add complexity for its own sake. UniOcc’s experiments show that per-voxel flow annotations measurably improve forecasting performance compared to occupancy-only labels, particularly for dynamic classes like vehicles and pedestrians. Building-side research lacks an equivalent standardized benchmark, which means cross-site generalization checks (training on one facility, testing on another) matter more than chasing a single leaderboard number.
How Do Buildings and Autonomous Vehicles Differ in Occupancy Forecasting?
The core math looks similar across domains, but the operating constraints diverge enough that a model built for one rarely transfers cleanly to the other.
- Buildings and hospitality: horizons stretch from hours to weeks, privacy concerns limit how granular tracking can get, and forecasts need to integrate with existing booking systems and HVAC controllers rather than run standalone.
- Healthcare operations: bed occupancy forecasting hinges on referral-to-bed timing as much as raw census counts, since a facility’s true available capacity depends on how fast intake, insurance verification, and clinical assessment move through the pipeline.
- Autonomous driving: horizons compress to sub-second and single-digit-second windows, computation happens on vehicle hardware with strict latency budgets, and per-voxel flow becomes essential rather than optional because a static occupancy snapshot is already stale by the time it’s acted on.
Buildings represent roughly 40% of global energy consumption, and occupant-centric HVAC control built on accurate occupancy forecasts is one of the more direct levers for cutting that footprint. Autonomous vehicles carry no comparable energy argument. Their forecasting stakes are safety, not efficiency, which is why flow-field precision gets prioritized over model simplicity.
What Deployment Challenges Should You Plan For?
Every occupancy forecasting rollout hits the same handful of obstacles, regardless of domain, and the fix tends to be procedural more than algorithmic.
- Cold start: begin with rule-based heuristics, move to simple ML once a few weeks of clean data accrue, and reserve complex models for when the data volume actually supports them. Jumping straight to a deep model on sparse history is the fastest way to overfit and lose stakeholder trust.
- Cross-site generalization: a model trained on one facility or one vehicle fleet often degrades on another. Federated and transfer learning approaches have reported strong results, with one framework citing figures up to 84% accuracy on 10-minute-ahead forecasts in cross-site setups where direct joint training wasn’t practical.
- Latency and compute: edge deployment suits autonomous vehicles and real-time HVAC control; cloud batch processing suits weekly hospitality or bed-occupancy forecasts where a few minutes of lag doesn’t matter.
- Drift and retraining: set a retraining cadence tied to observed accuracy decay, not an arbitrary calendar schedule.
- Privacy governance: default to zone-level aggregation over individual tracking wherever the use case allows it, and document what’s collected before deployment, not after.
Pro Tip: Log every cold-start heuristic’s error rate before replacing it. That baseline number is the only way to prove a new model earned its added complexity.
How Do You Pilot and Scale an Occupancy Forecasting System?
A workable rollout follows a short, disciplined sequence rather than a rush to the most sophisticated architecture available.
- Define the business metric and forecast horizon first, before touching any model. A hotel forecasting weekend arrivals needs a different setup than a nursing facility forecasting bed availability three days out.
- Inventory available data streams: booking systems, sensors, referral pipelines, or vehicle telemetry, and flag gaps early.
- Run a 2 to 12 week pilot using a simple baseline (moving average or basic ML) to establish a performance floor.
- Compare baseline results against one candidate ML model before considering transformer or flow-aware architectures.
- Adopt heavier models only when the pilot shows cross-zone or cross-sensor patterns that simpler models can’t capture.
- Roll out gradually, monitor drift monthly, and retrain based on observed accuracy decay rather than a fixed calendar.
What Do I Actually Recommend After Reviewing This Research?
Most teams overbuild before they understand their own data. Start with heuristics, measure their error honestly, and only escalate to transformer or flow-aware models once a real cross-zone pattern demands it. Per-voxel flow and dense sensor arrays earn their cost in autonomous driving and large multi-zone buildings, rarely in a single-site pilot.
— Harry
How Smartadmissions Turns Occupancy Forecasting Into Higher Bed Fill
Everything covered above about fusing signals and forecasting demand applies directly to skilled nursing and post-acute admissions, where the input data is referral volume, insurance verification turnaround, and clinical assessment timing rather than PIR sensors or LiDAR frames. Smartadmissions is built specifically for that translation: it pulls referral and admissions data into dashboards that show administrators where beds are likely to open and how fast the pipeline can fill them.
Facilities using this kind of referral-to-bed visibility have projected up to 12% higher bed occupancy as an outcome hypothesis based on internal data, a direct result of shortening the referral review window that otherwise stalls forecasting accuracy at the intake stage. If you’re an administrator or admissions director trying to move from guesswork to a real forecasting workflow, start by reviewing proven strategies for optimizing bed occupancy and see how automated referral review speeds up bed fill. Request a walkthrough of the platform to see how it maps to your own referral pipeline.
Sources
- UniOcc: A Unified Benchmark for Occupancy Forecasting and Prediction in Autonomous Driving
- A comprehensive framework for modeling building occupancy: technologies, methods, and research challenges