
TL;DR:
- Predictive analytics reduces readmissions by 10 to 50 percent and streamlines admissions workflows.
- AI-driven scoring improves bed occupancy, referral accuracy, and coding reimbursements while lowering administrative burdens.
- Successful adoption depends on data quality, workflow integration, staff training, and addressing bias and interpretability issues.
Most skilled nursing facilities and rehabilitation centers still rely on phone calls, fax machines, and manual chart reviews to manage patient referrals. That process is slow, error-prone, and costly. What’s changing the equation is predictive analytics, which AI implementations show can reduce 30-day readmissions by 10 to 50% while generating significant cost savings. This article breaks down what predictive analytics means for your admissions team, how it works inside real referral workflows, what outcomes you can realistically expect, and what challenges to plan for before you invest.
Table of Contents
- What is predictive analytics in healthcare admissions?
- How predictive analytics works in patient referrals and admissions
- Key outcomes: Reducing readmissions, optimizing fit, and impact benchmarks
- Challenges, limitations, and what most facilities miss
- Our perspective: What actually works and what’s often overlooked
- Next steps: Supercharge your admissions with predictive analytics
- Frequently asked questions
Key Takeaways
| Point | Details |
|---|---|
| Major efficiency boost | Predictive analytics significantly cuts readmissions and speeds up admissions workflows. |
| Best results need data integration | Combining EHR, referral, and patient data sources leads to the most accurate predictions. |
| Customize for your facility | Facilities must align predictive tools with local workflows, staff education, and equity strategies. |
| Start with pilots | Pilot programs and strong data governance help realize positive ROI and avoid common pitfalls. |
What is predictive analytics in healthcare admissions?
Predictive analytics uses historical and real-time data to forecast future outcomes. In healthcare admissions, that means analyzing patient records, referral patterns, payer information, and clinical indicators to help your team make faster and more accurate decisions.
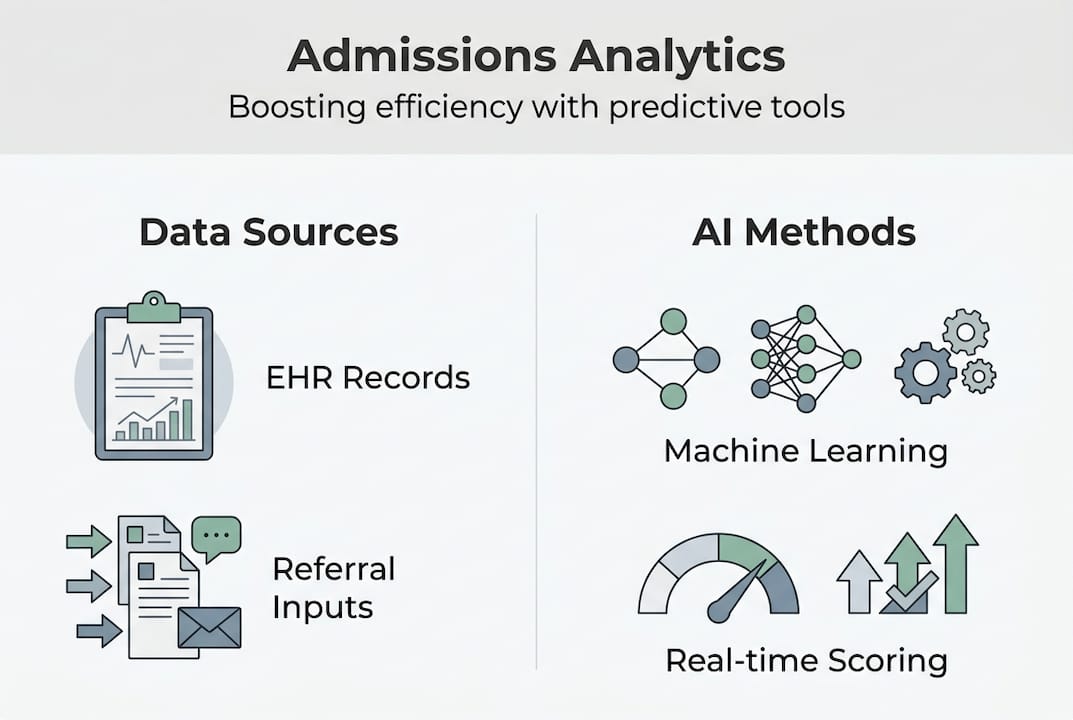
At its core, predictive analytics in SNFs uses AI and machine learning to process EHR data, referral network inputs, and population health signals. The goal is to score each incoming referral for clinical fit, reimbursement potential, and readmission risk before a bed is ever assigned.
This matters because admissions decisions are not just clinical. They affect occupancy rates, Medicare reimbursement, staffing ratios, and long-term financial performance. When your team can see a risk score alongside a referral, you move from reactive to proactive decision-making.
Here are the main benefits admissions teams report after adopting AI admissions software:
- Faster referral review times, often reduced from hours to minutes
- Higher referral acceptance accuracy, matching patient complexity to facility capabilities
- Reduced avoidable readmissions, with some tools reporting up to 50% improvement
- Improved bed fill rates, driven by real-time scoring and automated intake workflows
- Lower administrative burden, freeing staff to focus on clinical and relationship tasks
- Better payer mix management, through reimbursement probability scoring at intake
These are not theoretical gains. Facilities that integrate predictive tools into their admissions workflow consistently outperform those using manual processes on occupancy, readmission benchmarks, and staff satisfaction. The technology is no longer experimental. It is operational.
How predictive analytics works in patient referrals and admissions
Having established what predictive analytics is, let’s walk through how these tools fit into real-world referral and admissions workflows.
The process typically follows a structured sequence from referral receipt to bed allocation:
- Referral intake: A referral arrives from a hospital, physician, or care network. The system automatically pulls clinical data from the EHR and referral documentation.
- Data parsing: AI extracts structured fields (diagnosis codes, medication lists, functional scores) and unstructured data (clinical notes, discharge summaries) to build a patient profile.
- Predictive scoring: Machine learning models score the referral across multiple dimensions: clinical fit, length-of-stay (LOS) risk, readmission probability, and expected reimbursement.
- Decision support: Your admissions coordinator sees a scored summary, flagged risks, and a recommended action, all before making a single phone call.
- Bed allocation: Accepted patients are matched to appropriate care levels and bed types based on clinical and operational criteria.
- Outcome tracking: Post-admission data feeds back into the model to continuously improve prediction accuracy.
Common methodologies include AI-powered scoring using machine learning models such as Random Forest, XGBoost, and Support Vector Machines (SVM), each suited to different prediction tasks.
| Model | Primary use case | Accuracy benchmark |
|---|---|---|
| Random Forest | Discharge destination, LOS prediction | Up to 98% for orthopedic cases |
| XGBoost | Readmission risk, ED admission timing | High accuracy in hourly predictions |
| SVM | Clinical classification, payer scoring | Strong on structured datasets |
| Hybrid (structured + notes) | Referral fit, complex case scoring | Best overall clinical acceptance |
Hybrid models that combine structured EHR fields with unstructured clinician notes consistently outperform single-source models. They capture nuance that coded data alone misses.
Integration with your existing EHR, referral portals, and intake process optimization tools is essential. Without clean data pipelines, even the best model produces unreliable scores.

Pro Tip: Prioritize platforms that integrate directly with your admissions intake workflow. Real-time scoring at the point of referral review, rather than batch processing overnight, is where you gain the most operational speed when using AI admission tools.
Key outcomes: Reducing readmissions, optimizing fit, and impact benchmarks
Understanding workflow integration leads naturally to results. Here’s what real data and case studies reveal about predictive impact.
| Metric | Traditional methods | AI/predictive tools |
|---|---|---|
| 30-day readmission rate | Baseline facility average | Reduced by 10 to 50% |
| Referral review time | 2 to 4 hours average | Under 30 minutes |
| Bed occupancy rate | Variable, often reactive | Improved through proactive scoring |
| LOS accuracy | Low without predictive tools | Significantly improved with ML models |
| HRRP penalty exposure | Higher without intervention | SNF readmissions lowered by 1.4% under HRRP programs |
Allina Health’s implementation of AI-driven readmission tools produced a 10.3% reduction in 30-day readmissions. Safety-net facilities using similar tools reported a 4% reduction. Some predictive platforms claim up to 50% improvement when deployed with strong data governance and staff adoption.
“AI implementations have demonstrated reductions in 30-day readmissions ranging from 10% to 50%, with measurable cost savings across safety-net and community health settings.”
Beyond readmissions, facilities report these operational gains:
- Referral acceptance rates improve because teams can quickly identify which patients are the right clinical and financial fit
- Resource allocation becomes more precise, reducing over-staffing on low-acuity days and under-staffing on high-complexity admissions
- Revenue cycle performance strengthens through better payer mix management at intake
- Staff burnout decreases when automating admissions removes repetitive manual tasks from daily workflows
- Care quality metrics improve because the right patients are matched to the right level of care from day one
The financial case is equally strong. Avoiding a single preventable readmission can save a facility thousands of dollars in penalties and care costs. When AI streamlining intake is applied consistently, those savings compound across hundreds of admissions per year.
Challenges, limitations, and what most facilities miss
Even with positive benchmarks, challenges remain. Let’s examine what can go wrong and how to avoid common mistakes.
Not every SNF or rehabilitation center sees equal results from predictive tools. The gap between high performers and underperformers often comes down to data readiness and implementation discipline, not the technology itself.
Key challenges in predictive analytics include data quality gaps, integration barriers, model interpretability issues, and equity concerns, particularly in rural or low-resource settings.
Here is what your team should watch for:
- Fragmented data sources: If your EHR, referral portal, and billing system don’t communicate, the model is working with incomplete information. Garbage in, garbage out.
- Integration gaps: Many facilities adopt a predictive tool but fail to connect it to their live admissions workflow. Scores generated in isolation don’t change behavior.
- Black-box model risk: When staff can’t understand why a referral was scored a certain way, they stop trusting the system. Explainability is not optional.
- Workflow adoption resistance: Admissions coordinators who have worked a certain way for years may resist AI-generated recommendations. Change management is as important as the technology.
- Equity and bias risks: Models trained on data from well-resourced, urban facilities may underperform in rural or underserved settings, producing biased scores that disadvantage certain patient populations.
- Overfitting to historical patterns: A model trained on pre-pandemic data may not accurately reflect current referral and readmission dynamics.
Pro Tip: Before expanding any predictive analytics tool facility-wide, run a structured pilot program on a defined referral cohort. Establish clear ROI benchmarks upfront. Pair the pilot with a data governance review to identify and fix the most common data quality issues. This approach builds staff trust and gives leadership the evidence needed to commit to AI referral management at scale.
Our perspective: What actually works and what’s often overlooked
To tie it all together, here’s a ground-level perspective on what separates high-performing admissions teams from the rest.
The most common assumption is that the barrier to better admissions outcomes is the technology. It isn’t. The real barrier is data culture and change management. Facilities that invest in cleaning their data, aligning workflows, and explaining predictions to frontline staff consistently outperform those that simply install a tool and expect results.
Hybrid models and explainable AI tools like SHAP can significantly boost clinical trust and prediction accuracy when staff understand the reasoning behind each score. SHAP (SHapley Additive exPlanations) breaks down which data points drove a specific prediction, making AI recommendations interpretable to non-technical users.
Most teams underinvest in staff education on using AI insights. An admissions coordinator who understands why a referral scored high for readmission risk will act on that information. One who sees a number without context will ignore it.
The facilities seeing the best results from predictive analytics treat it as a decision support layer, not a replacement for clinical judgment. That framing matters. It reduces resistance, builds trust, and accelerates adoption. If you want to understand the truth about AI admissions in practice, start with your team’s readiness before you evaluate any platform.
Next steps: Supercharge your admissions with predictive analytics
If you’re ready to turn insights into action and streamline your admissions, here’s where to dive deeper.
Smart Admissions gives your team the tools to act on predictive data in real time, from automated referral scoring to EHR-integrated intake workflows. You don’t need a data science team to get started.
Explore our guide on skilled nursing workflow optimization to see how facilities are restructuring their intake operations for speed and accuracy. If you’re evaluating whether to automate admissions, our benchmarking data shows a clear path to 20% faster bed occupancy. You can also review referral management systems that fit the operational needs of SNFs and rehabilitation centers. Request a demo to see how Smart Admissions fits your workflow.
Frequently asked questions
Which predictive models are best for SNF and rehab admissions?
Random Forest and XGBoost are top performers for predicting readmissions and LOS risk, especially when integrated with both clinical and operational data. Random Forest achieves up to 98% accuracy for orthopedic discharge destination prediction, while XGBoost excels at hourly ED admission forecasting.
How much can predictive analytics reduce readmissions?
Predictive analytics has been shown to cut 30-day readmissions by 10 to 50%, depending on starting benchmarks and implementation quality. Allina Health achieved a 10.3% reduction, while other implementations report higher gains with stronger data governance.
What are the main challenges in implementing predictive analytics?
Top barriers include poor data quality, integration hurdles, lack of explainability, bias potential, and workflow adoption resistance. Main challenges also include black-box model concerns and equity risks in underserved settings.
How can we address bias and equity issues in predictive admissions tools?
To reduce bias, invest in diverse data sources, use explainable AI, and pilot tools in underserved or rural SNFs before general rollout. Explainable AI approaches help surface and correct inequitable scoring patterns before they affect patient placement decisions.