
TL;DR:
- More referrals do not guarantee increased admissions, as acceptance rates remain below 37% and fluctuate significantly. Facilities investing in data analytics identify where and why admissions slip away, enabling targeted improvements in referral processes. Prioritizing real-time insights, performance benchmarking, and governance enhances conversion rates and optimizes bed occupancy.
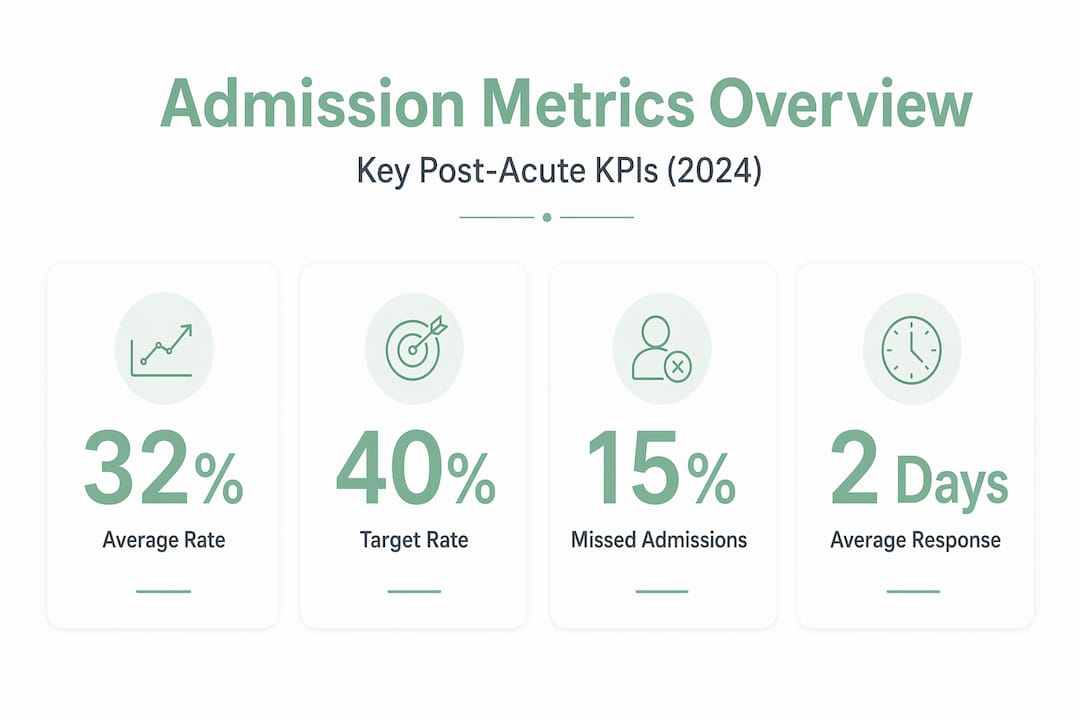
More referrals do not automatically mean more admissions. That assumption has cost many skilled nursing facilities and rehabilitation centers significant revenue. Referral acceptance rates have never climbed above 37% in post-acute care, dropping as low as 23.6% in 2022, with providers averaging 6.6 referral submissions per patient and only 32% of referrals accepted in 2024. These numbers expose a critical gap between incoming referral volume and actual bed occupancy, and the facilities that close that gap are the ones investing in data analytics to understand exactly where and why admissions slip away.
Table of Contents
- Why traditional referral processes fall short
- Key analytics metrics and benchmarks in post-acute care
- Harnessing analytics to capture more admissions
- Improving analytics governance: Beyond just accuracy
- A smarter approach: Don’t chase rates—optimize your capture
- Transform your admissions process with actionable analytics
- Frequently asked questions
Key Takeaways
| Point | Details |
|---|---|
| Referrals aren’t admissions | Most referrals do not result in admissions, so tracking actual conversions is essential. |
| Measure with the right metrics | Acceptance rates, referral-per-patient, and leakage rates reveal real opportunities for improvement. |
| Analytics make edge cases visible | Advanced data tools uncover process gaps and prevent denials and missed opportunities. |
| Governance prevents hidden risks | Strong analytics governance reduces bias and improves fairness in patient assessments. |
| Optimize your workflow | Focusing on operational transparency drives higher admissions and better patient outcomes. |
Why traditional referral processes fall short
With this context, let’s look at how the existing referral process creates bottlenecks and inefficiencies that limit your admissions conversion rate.
Most admissions teams still operate under a one-to-one model: one referral equals one potential admission. In practice, this rarely holds true. Patients are referred to multiple facilities simultaneously, and the same patient may generate several referral submissions across different providers before a placement is confirmed. This creates a misleading picture of demand. Your team may feel busy processing a high volume of referrals while actual admissions remain flat.
“Admissions teams should expect referral acceptance and capture to be constrained and variable. Benchmarking requires considering multiple referral attempts per patient.”
This variability is a core reason why traditional, spreadsheet-based tracking systems fail. They count referrals received, not referrals converted. Without a way to account for duplicate submissions, pending cases, and withdrawn referrals, your team cannot generate accurate performance data. Decisions are made on numbers that look strong on the surface but do not reflect your facility’s true conversion efficiency.
The operational consequences are real. Consider the following common failures in traditional referral workflows:
- No standardized response time tracking: Teams respond to referrals inconsistently, with some cases waiting hours and others receiving a reply within minutes, creating an uneven referral-to-bed conversion window.
- Manual documentation review: Staff spend significant time manually pulling records from fax machines, email inboxes, and disconnected EHR systems, increasing the risk of missing critical clinical information.
- Referral leakage: Referrals fall through the cracks due to unclear ownership, incomplete intake checklists, or delayed payer verification, often without the team knowing a potential admission was lost.
- No post-decline analysis: When your team declines a referral, there is typically no structured process to capture why, making it impossible to identify patterns or training opportunities.
These are not minor inconveniences. They represent measurable referral-to-bed benchmarks that directly affect bed occupancy and revenue. Facilities that rely on manual processes are essentially operating blind, making it extremely difficult to improve what they cannot clearly measure. Moving toward automated referral efficiency is the first step toward closing these gaps.
Key analytics metrics and benchmarks in post-acute care
Recognizing shortcomings in traditional processes, it’s critical to establish which metrics matter most for your admissions team.
Referral acceptance rates have averaged around 32% in 2024 and have never exceeded 37%, which means that for every three referrals your team processes, at least two will not convert to an admission. Understanding this baseline is essential before your team can evaluate whether your own performance is on par, below, or above industry norms.
Here are the four metrics that every admissions team should track consistently:
- Referral acceptance rate: The percentage of received referrals that result in an admission. This is your primary conversion metric and should be tracked weekly, not just monthly.
- Multiple-referral-per-patient rate: How many referral submissions your facility receives for the same patient. A high rate here often signals that your facility is competing for patients but losing them to faster-responding competitors.
- Capture rate: The proportion of patients who were referred to your facility, expressed interest, and ultimately admitted. This accounts for patient choice and clinical fit, providing a more nuanced view of conversion.
- Referral leakage rate: The volume of referrals that enter your intake workflow but never result in a formal decision, either accepted or declined. High leakage rates indicate operational gaps that cost your facility revenue.
The table below shows how current benchmarks compare against performance targets that leading post-acute care facilities are working toward:
| Metric | Industry benchmark (2024) | Target performance |
|---|---|---|
| Referral acceptance rate | 32% average | 40% or higher |
| Multiple referrals per patient | 6.6 submissions | Under 4.0 submissions |
| Referral response time | 4 to 6 hours | Under 2 hours |
| Referral leakage rate | 15 to 25% | Under 10% |
Tracking these metrics accurately through a centralized analytics platform enables targeted interventions. For example, if your multiple-referral-per-patient rate is consistently high, that indicates your response time is too slow and competitors are accepting patients before your team even completes the intake review. If your referral conversion efficiency metrics show a high leakage rate, the problem is likely internal, rooted in documentation delays or unclear staff accountability.
The value of benchmarking is not just in knowing where you stand. It is in knowing where to focus your improvement efforts first.
Harnessing analytics to capture more admissions
Now that you know what to measure, let’s see how actionable analytics can move the needle for your team in practical, concrete ways.
Analytics tools do far more than generate reports. When integrated with your EHR system and payer verification portals, they surface real-time insights that your team can act on during the referral review window, not after a patient has already been placed elsewhere.

One of the most valuable applications is identifying missed admissions tied to documentation conflicts. For example, a patient may arrive in your intake queue flagged as “Medicare Part A eligible,” but a closer examination reveals the patient was admitted to the hospital under observation status rather than inpatient status. This distinction disqualifies the patient from Medicare skilled nursing coverage, which is a fact that manual intake processes often catch too late or miss entirely. Analytics platforms configured to flag this edge case in real time allow your team to address payer eligibility before accepting or declining the referral, avoiding a costly denial later.
Analytics tools can surface not only clinical but also operational and administrative edge cases, and explicit handling of uncertainty and conflicts is needed to prevent loss of clinician trust and increased denials and readmissions. This means that building your analytics workflow around exception handling is just as important as tracking your core metrics.
Consider these specific use cases where analytics directly improves capture rates:
- Payer status conflicts: Analytics flags mismatches between stated insurance coverage and actual eligibility data pulled from payer portals, allowing your team to request updated documentation before committing to an admission.
- Observation vs. inpatient status: Automated rules alert staff when hospital records indicate observation status, triggering a secondary review before proceeding with intake.
- Documentation completeness scoring: Each referral is scored based on how complete the clinical and administrative documentation is, allowing your team to prioritize high-readiness referrals and follow up on incomplete ones systematically.
- Referral source performance: Analytics tracks which referring hospitals and case managers send the highest-quality, most convertible referrals, helping your team build stronger relationships with those sources.
Pro Tip: Use your analytics platform to set automated alerts for referrals that have been in your intake queue for more than 90 minutes without a documented response. Speed is one of the most controllable factors in referral conversion, and setting internal response time standards with automated tracking keeps your team accountable.
Investing in referral process automation is not about replacing your admissions team. It is about removing the manual friction that slows them down and causes high-value referrals to go unactioned.
Improving analytics governance: Beyond just accuracy
Maximizing analytics isn’t just about measurement — it demands strong governance practices too. This is an area where many facilities invest in a platform and then underutilize it because they rely too heavily on top-level accuracy metrics without examining what is happening beneath the surface.
Subgroup performance, fairness, and clinical utility matter deeply, especially for rare or misleadingly similar edge cases. In practical terms, this means a model that is 85% accurate overall can still perform poorly for specific patient populations, such as patients with dual eligibility for Medicare and Medicaid, patients transferred from rural hospitals with limited documentation, or patients with complex, multi-diagnosis profiles that fall outside common intake categories.
“Be cautious using general model performance. Subgroup performance, fairness, clinical utility, and calibration by condition and setting matter, especially for rare or misleadingly similar edge cases.”
Strong analytics governance at your facility should include the following practices:
- Regular subgroup audits: Break down your acceptance, leakage, and denial rates by payer type, diagnosis category, referring facility, and patient demographics. Patterns that look acceptable at the aggregate level may reveal serious gaps within specific groups.
- Calibration reviews: Ensure that your predictive models or eligibility scoring tools are regularly recalibrated against real admission outcomes, not just initial referral data. A model that has not been updated in 12 months may be making recommendations based on outdated payer rules or clinical criteria.
- Clinical utility testing: Ask your team whether the analytics outputs actually change their decisions. If staff consistently override model recommendations without a structured process to capture why, the model is generating noise rather than signal.
- Documentation of uncertainty: Not every referral will have clean, complete, and consistent data. Your governance framework should define how your team handles and documents cases where the data is ambiguous, so that decisions are traceable and reviewable.
These governance practices connect directly to AI-driven eligibility verification workflows that need to maintain accuracy across diverse patient populations. Reliable decision-making in admissions requires that your analytics infrastructure is not just functional but actively governed and continuously improved. Facilities that invest in governance frameworks alongside their analytics tools see more consistent, defensible admissions decisions over time.
For broader context on how digital infrastructure supports these goals across care settings, resources from digital healthcare solutions providers offer useful frameworks for understanding technology integration at scale.
Pro Tip: Assign a specific team member or department lead the responsibility of reviewing analytics governance at least quarterly. Without clear ownership, governance reviews fall off the calendar, and model drift goes undetected until it starts affecting your denial rates.
A smarter approach: Don’t chase rates—optimize your capture
With technical best practices in mind, here is a perspective that most facilities overlook when they start investing in analytics.
Many admissions leaders respond to low acceptance rates by trying to increase referral volume. The logic feels sound. If you accept 32% of your referrals and you want more admissions, receiving more referrals should produce more admissions. But this approach treats a process problem like a volume problem, and it rarely works as expected.
The real opportunity is in improving what happens between referral receipt and the final admissions decision. Your team can receive a hundred more referrals per month and still convert the same percentage if the underlying workflow has not changed. In contrast, a facility that reduces response time from six hours to 90 minutes, fixes its documentation review process, and eliminates payer verification delays can see meaningful conversion gains from the same referral volume.
This is why investing in analytics and referral tracking strategies that identify where referrals slip through the cracks creates more sustainable growth than simply marketing your facility to more hospitals. The visibility that good analytics provides shows you the exact points in your intake process where decisions slow down, where documentation is incomplete, and where your team is spending time on tasks that could be automated.
When operational discipline and quality analytics work together, admissions teams are able to make faster, better-informed decisions, improve their relationships with referring providers through reliable and transparent responses, and ultimately admit more of the right patients without inflating their workload. The facilities that thrive are not the ones chasing the highest referral counts. They are the ones who understand precisely why each referral converts or does not, and who use that knowledge to continuously sharpen their intake process.
Transform your admissions process with actionable analytics
Data analytics in post-acute care is most powerful when it is built into the tools your admissions team already uses every day, not separated into a standalone reporting dashboard that staff check once a week.
Smart Admissions is purpose-built for skilled nursing facilities and rehabilitation centers that need real-time insight into their referral-to-admission workflow. From faster bed occupancy through automated intake workflows to admissions efficiency automation that reduces manual review time, our platform integrates with your existing EHR and payer systems to deliver the metrics your team needs at the moment decisions are made. Explore referral management system examples to see how other post-acute providers have restructured their intake process for measurable gains in bed fill rate and admissions conversion. Your team deserves tools that work as hard as they do.
Frequently asked questions
What is the average referral acceptance rate in post-acute care?
Referral acceptance rates in post-acute care have rarely exceeded 37%, averaging 32% in 2024, with significant variability by facility type and payer mix.
How does data analytics help reduce missed admissions?
Analytics tools identify exactly where referrals fall through due to workflow breakdowns, documentation errors, or payer conflicts, enabling your team to intervene before a potential admission is lost.
What operational metrics should admissions teams track?
Your team should consistently track referral acceptance rate, multiple-referral-per-patient rate, capture rate, and referral leakage rate, as these key benchmarks provide the clearest picture of conversion efficiency.
Why is analytics governance important in post-acute care?
Governance ensures your analytics tools remain accurate, fair, and clinically useful across all patient groups, preventing subgroup performance gaps from generating incorrect decisions for vulnerable or complex patient populations.
How can facilities get started with post-acute analytics?
Start by documenting your current referral volume, acceptance rate, and average response time, then identify your highest-leakage stage in the intake process. From there, platforms like Smart Admissions provide automation, analytics, and benchmarking tools designed specifically for post-acute care facilities.